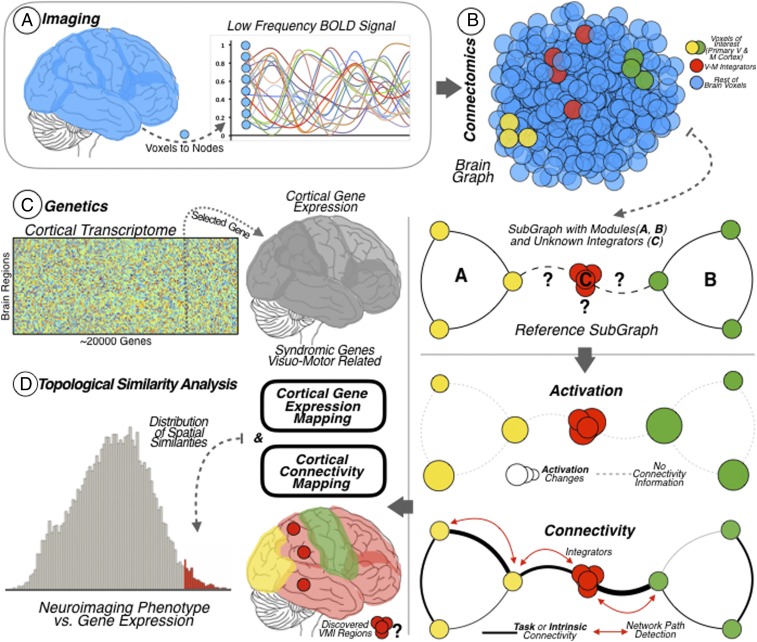
Fig. 3.
Pipeline overview. (A) Neuroimaging data. Functional MRI BOLD data of the cerebral cortex was recorded at the voxel level for subsequent graph functional connectivity analysis at the node level. (B) VMI network. Degree centrality analysis was used to investigate the whole-brain functional connectivity of all brain nodes. Then, SFC was used to investigate the connections departing from modal areas with the aim of discovering their intersection. Two modal areas were studied: the primary visual cortex (represented as yellow dots and as the modal network A) and the primary motor cortex (represented as green dots and as the modal network B). The method revealed the cortical areas supporting the integration of visual and motor information (represented as red dots and as the modal network C). (Bottom) Brain functional connectivity graphs derived from resting-state and task datasets were combined with a task-activation dataset for building the VMI network cortical map. Task activation detects the activation changes throughout the cortex and functional connectivity points out the connections (links or paths) between cortical regions. (C) Brain genetics. Diagram of the genetic expression matrix for the 20,737 protein-coding genes from the AHBA, across the 68 brain cortical regions included in the surface anatomical transformation of the Desikan–Killiany atlas. The brain map allows investigating whole-brain transcriptome including the genetic expression levels of syndromic genes associated with visuomotor functions. (D) Neuroimaging–genetics relation. A topographical similarity analysis was done between the VMI network cortical map and the cortical gene expression map of the syndromic genes. This analysis allows localizing the genes with high cortical expression within the VMI network map (area of the histogram highlighted in red, corresponds to similarity scores above 1.96 SDs).

