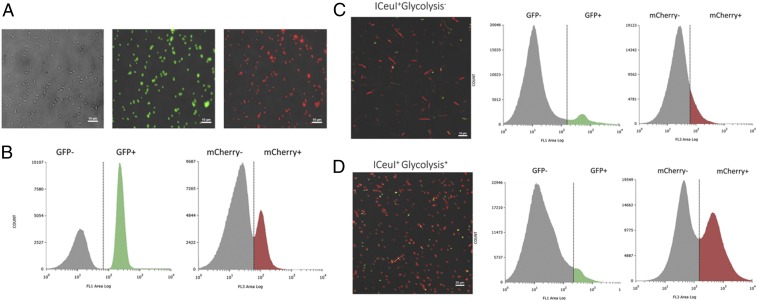
Fig. 2.
FL1 (GFP) and FL3 (mCherry) channel histograms of flow cytometry analyses and corresponding microscopy images. (A) Fluorescence microscopy images of a control strain (no I-CeuI) to show integrity of the GFP and mCherry biosensors. The parent strain (I-CeuI-) was (Left) not induced, (Center) induced for GFP expression, or (Right) induced for mCherry expression. (B) FL1 (GFP) and FL3 (mCherry) channel histograms had distinct populations which were used to define no expression and GFP expression (SimCell identity gates) or mCherry expression (protein production) when two populations were not obvious in the experimental groups. (C) The I-CeuI+ strain without the glycolysis pathway (pSEVA224-GB3) contained a mixed population of SimCells and normal cells. Based on the two somewhat distinct populations, about 91.32% of cells are SimCells (GFP-). Of the SimCell population, only 13.18% produced mCherry. (D) In the I-CeuI+ strain with the glycolysis pathway (pSEVA224-GB3), about 94.36% of cells are SimCells (GFP-), a slightly higher proportion compared to the strain without glycolysis. Of the SimCell population, 56.20% produced mCherry, a large improvement compared to the strain without glycolysis.

