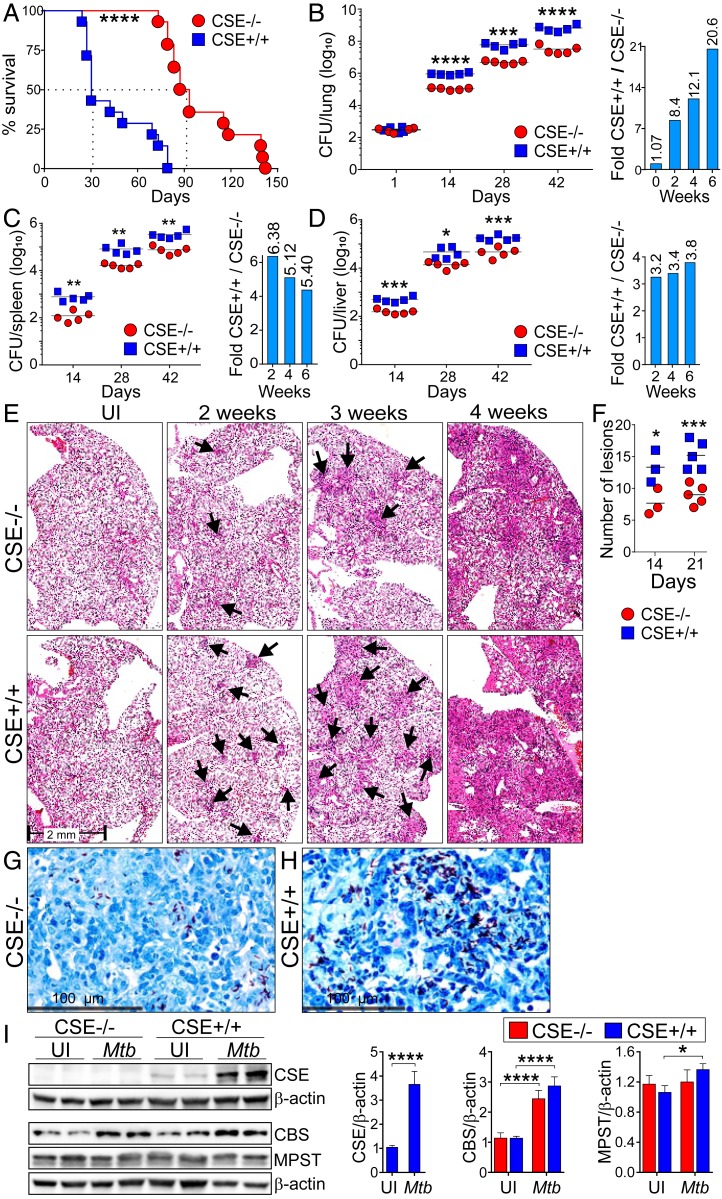
Fig. 2.
CSE promotes Mtb growth in mice. CSE−/− and WT (CSE+/+) mice were infected with Mtb and observed for the degree of disease severity. (A) Survival study of Mtb-infected CSE−/− and WT mice (n = 14). Bacterial burden (CFU) in the (B) lung, (C) spleen, and (D) liver of Mtb-infected mice over the course of infection. Bar graphs in the Right panels represent the fold-change in CFU between WT and CSE−/− mice (n = 5). (E) Representative images of hematoxylin and eosin (H&E)-stained mouse lung sections of Mtb-infected mice over the course of infection. Arrows point to lesions. (F) Number of granulomatous lesions observed in the mouse lung sections stained with H&E after 14 and 21 d postinfection. Each symbol represents a mouse. Representative images of Ziehl–Neelsen stained (ZN) bacilli in Mtb-infected (G) CSE−/− and (H) WT mouse lung sections on day 21 postinfection. (Scale bar, 100 µm.) (I) Western blot showing production of CSE, CBS, and MPST in lungs of uninfected (UI) and Mtb-infected CSE−/− and WT mice at 3 wk postinfection (n = 2). Densitometric analysis of the Western blot bands are shown as relative protein expression normalized to β-actin band intensities. The relative protein expression observed in the uninfected WT mice has been normalized to 1. The unpaired Student t test was used for colony forming units (CFU) data and the two-way ANOVA was used for all other data. Data are representative of two independent experiments; ****P < 0.0001; ***P < 0.001; **P < 0.01; *P < 0.05.

