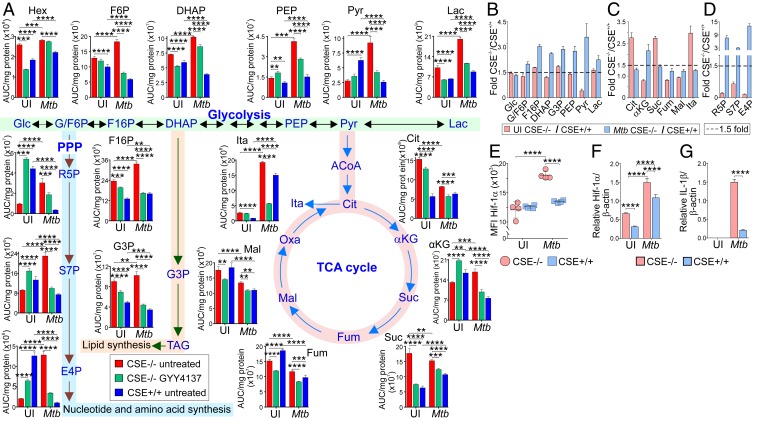
Fig. 6.
CSE controls glycolysis and the pentose phosphate pathway. (A) Normalized levels of metabolites of glycolysis, the PPP, and the TCA cycle in uninfected and Mtb-infected PM 24 h postinfection that are treated or not with 50 µM GYY4137. Red bars, CSE−/− untreated; green bars, CSE−/− treated with 50 µM GYY4137; and blue bars, WT untreated. (B–D) Fold-change in metabolite levels of (B) glycolysis, (C) the TCA cycle, and (D) the PPP of uninfected (red) and Mtb-infected (blue) CSE−/− versus WT PM. (E) Levels of intracellular Hif-1α, and RNA transcription of (F) Hif-1α and (G) IL-1β relative to the β-actin gene in uninfected and Mtb-infected PM 24 h postinfection. Error bars represent SD from the mean of four biological replicates. Two-way ANOVA was used to determine statistical significance. Data are representative of two independent experiments; ****P < 0.0001; ***P < 0.001; **P < 0.01.

