
Figure 4.
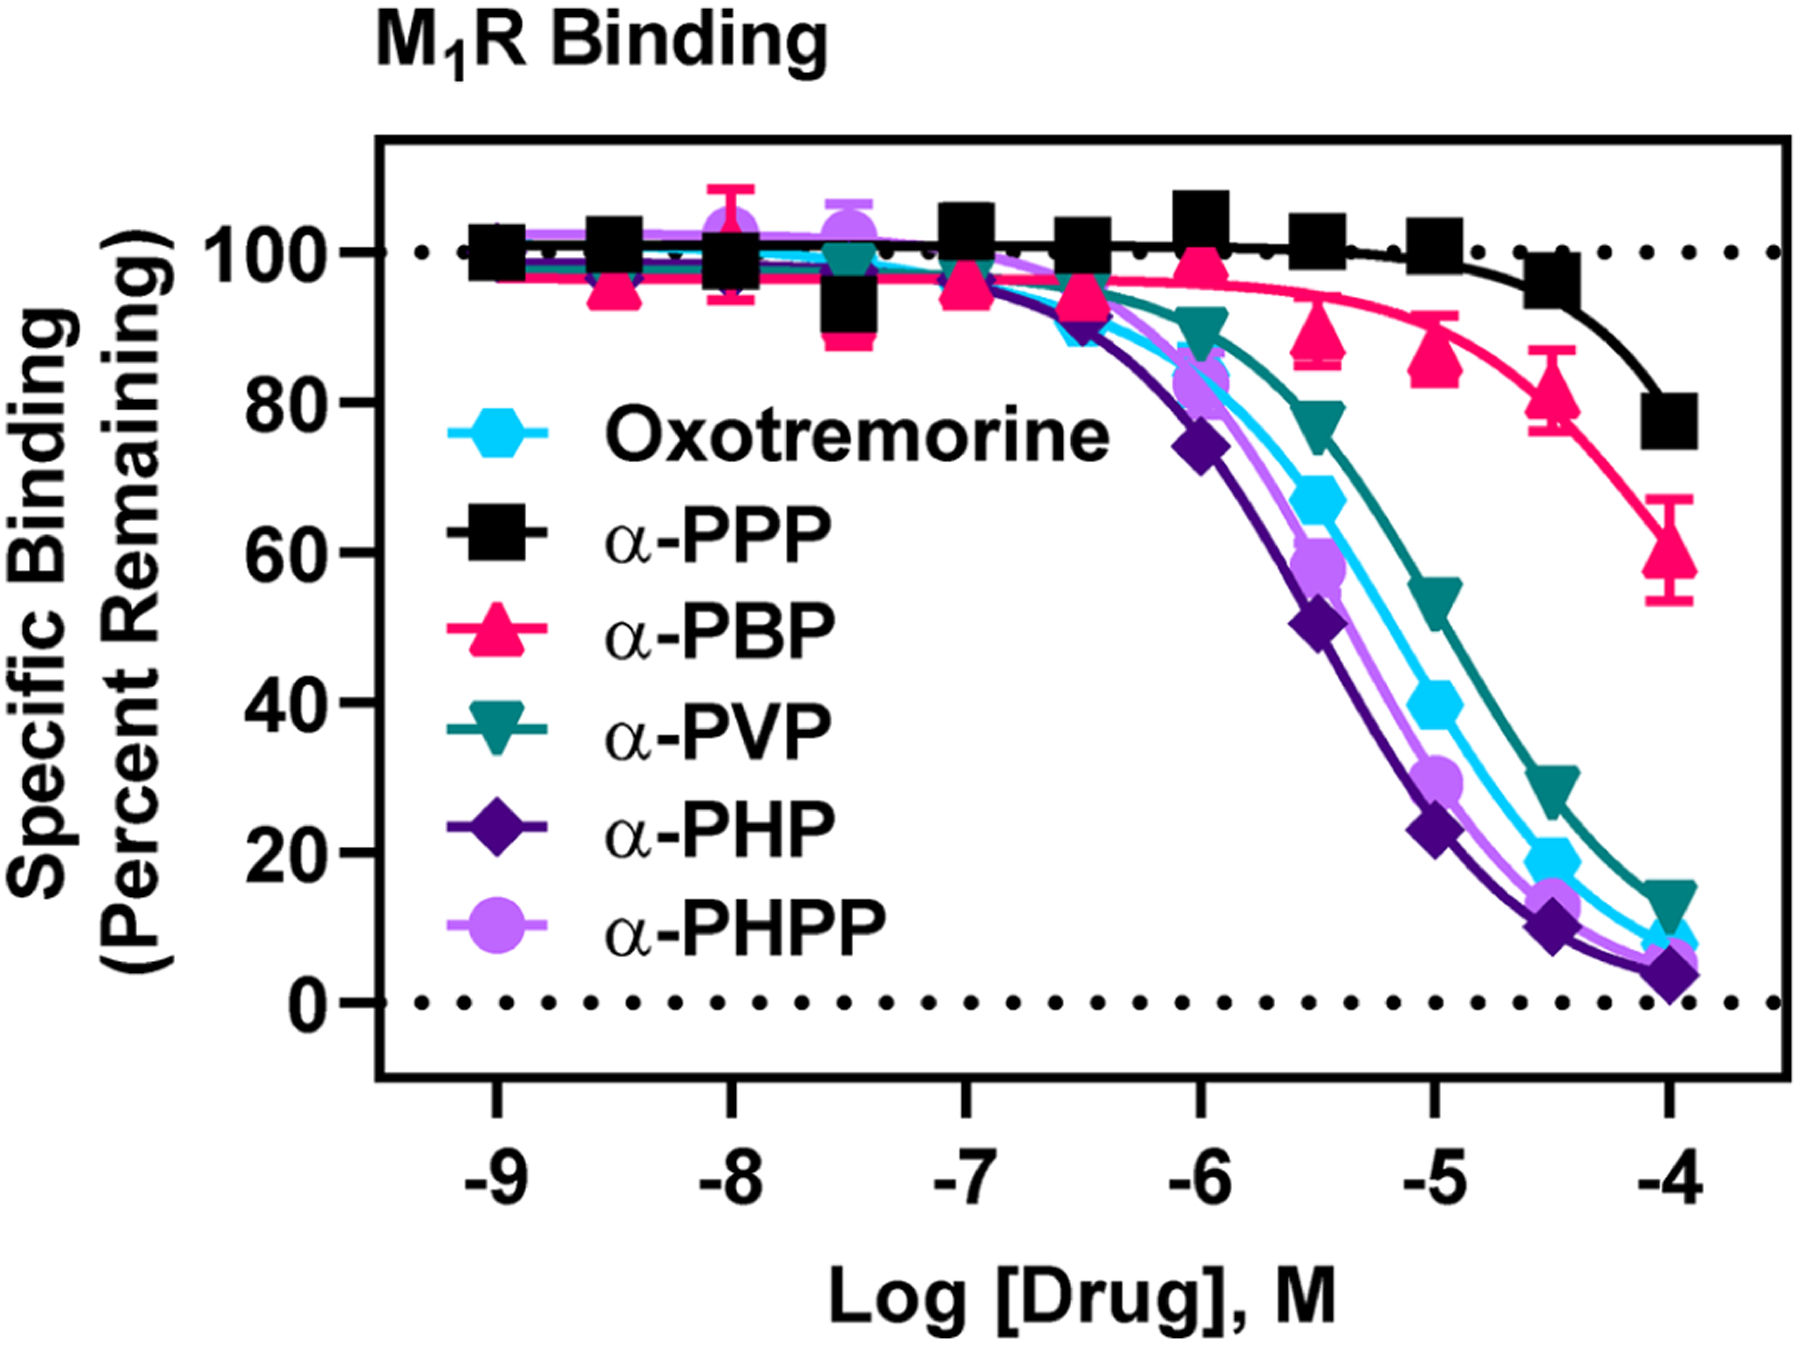
[3H]Scopolamine competition binding at M1Rs reveals low micromolar affinity of α-PHP. Data are expressed as normalized means (±SEM) of three, independent determinations, with drugs tested at each concentration in triplicate. Curves for PSCs were best fit with a one-site model, whereas the oxotremorine curve best fit to a two-site model, suggestive of oxotremorine’s agonist activity, recognizing agonist high and low affinity M1R conformations. Note that α-PHP exhibited the highest affinity at M1Rs of all PSCs tested.