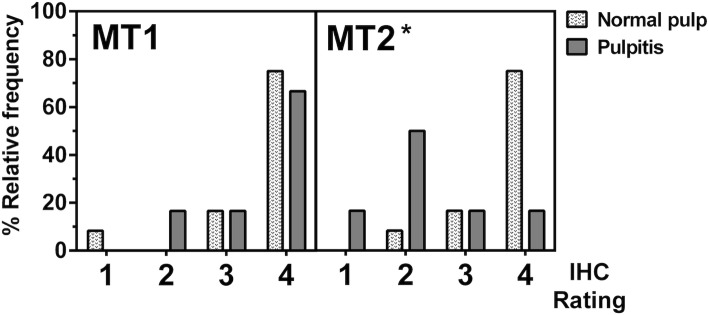
Fig. 4.
Histogram shows a relative frequency of MT1 and MT2 signal intensities from an immunostaining of paraffin-embedded normal and diseased pulps. A scale of 0–4 indicates the level of expression from the weakest to the strongest staining signals. Please note that none of the stained samples was scored as 0. Statistical analysis found that MT2 expression in normal pulps was significantly different from that of inflamed pulps (P-value< 0.001), whereas MT1 expression compared between health and disease of the pulp was not statistically different (P-value = 0.559). Asterisk (*) indicates statistical difference at P-value < 0.05 as determined by using Mann-Whitney U test

