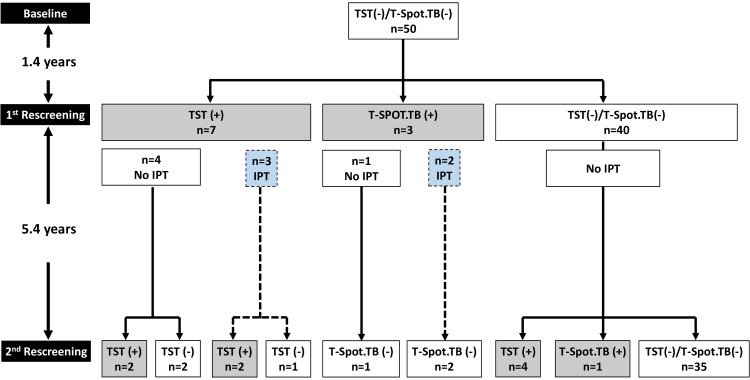
Figure 1.
Flow chart of rheumatic patients with negative baseline TB screening. The flow chart of the 50 patients with negative baseline tuberculosis (TB) screening (by tuberculin skin test-TST and T-SPOT.TB) who were included in the study is depicted. The mean time (in years) between baseline and first rescreening as well as between the first and second rescreening is shown in the left side of the figure. Patients who converted at the first rescreening and were treated with IPT (isoniazid preventive therapy) are also shown (blue boxes and dashed lines).

