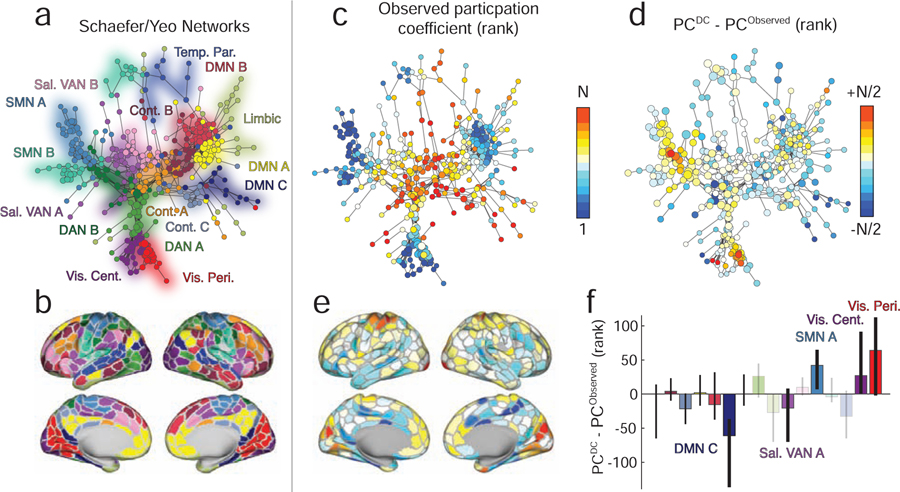
FIG. 3. Effect of distance correction on canonical brain systems and hubness.
(a) A spring-embedded layout of minimum spanning tree for the original network with no distance correction. Each node corresponds to a brain region, and colors indicate the system to which that region is assigned. (b) A surface representation of system labels from panel a. (c) Similar to panel a except color now indicates nodes’ ranked participation coefficients calculated using the original network and with respect to the canonically defined brain systems. (d) The difference in ranked participation coefficient after correcting for distance. (e) Participation coefficient differences projected onto the cortical surface. (f) Mean difference in participation coefficient aggregated by system. Opaque and labeled systems are those whose mean difference exceeded chance levels (false discovery rate controlled at 5%).

