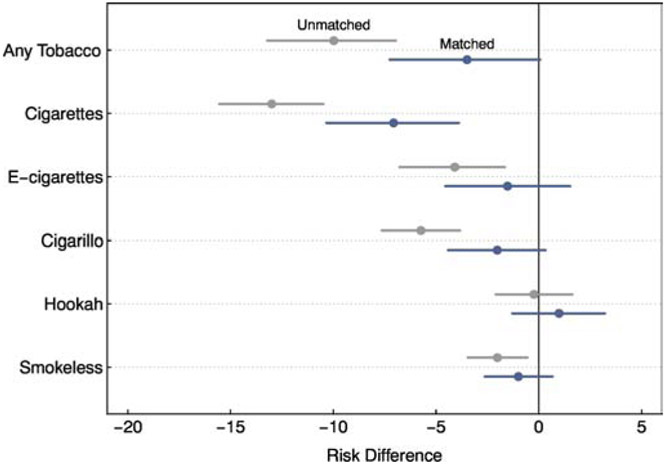
Figure 3. Differences in the risk of using tobacco by college attendance in the full unmatched sample and the propensity score matched sample, among the cohort of youth (<18 years) who aged into early adulthood (18-24 years) between Waves 1 and 3 of the PATH Study, United States, 2013-14, 2015-16.
Notes: Each dot in the figure indicates the difference in risk of using the specific tobacco product corresponding to the row between college attenders and nonattenders and line segments indicate 95% CIs for those risk difference estimates. Negative values indicate lower risk among college attenders vs. nonattenders while values at 0 indicate no difference. Grey dots and segments were estimated using the full unmatched sample and blue dots and segments were estimated using the matched sample. Nearest-neighbor matching was used to balance the matched sample with a 1:1 matching ratio and a caliper of 0.1.

