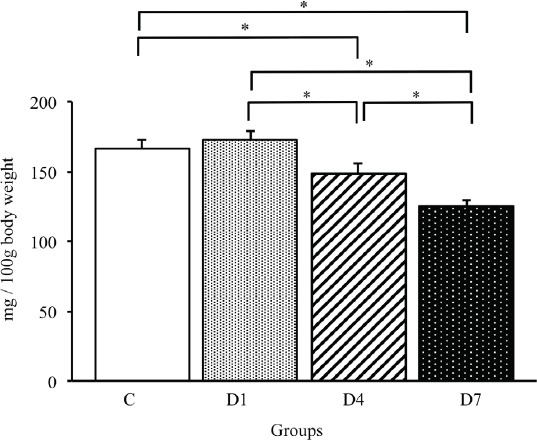
Figure 1.

Relative tibialis anterior muscle weights in control, D1, D4 and D7 groups. Values are the mean ± SD. Relative muscle weights are presented as mg/100 g of body weight. C: control group. D1: day 1 post-denervation group. D4: day 4 post-denervation. D7: day 7 post-denervation. *p<0.05.
