
Figure 6.
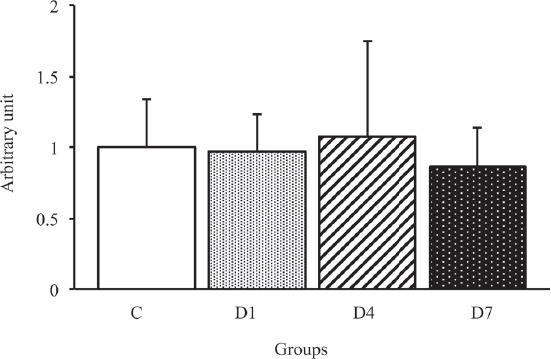
α1-syntrophin protein expression levels in the tibialis anterior muscles in control, D1, D4 and D7 groups. C: control group. D1: day 1 post-denervation group. D4: day 4 post-denervation. D7: day 7 post-denervation. α1-syntrophin protein expression levels, normalized by the GAPDH protein expression level, were calculated by densitometric analysis. Values are the mean ± SD. Fold changes were expressed relative to the levels observed in the C group. There were no significant differences in the expression level of α1-syntrophin protein among all groups.