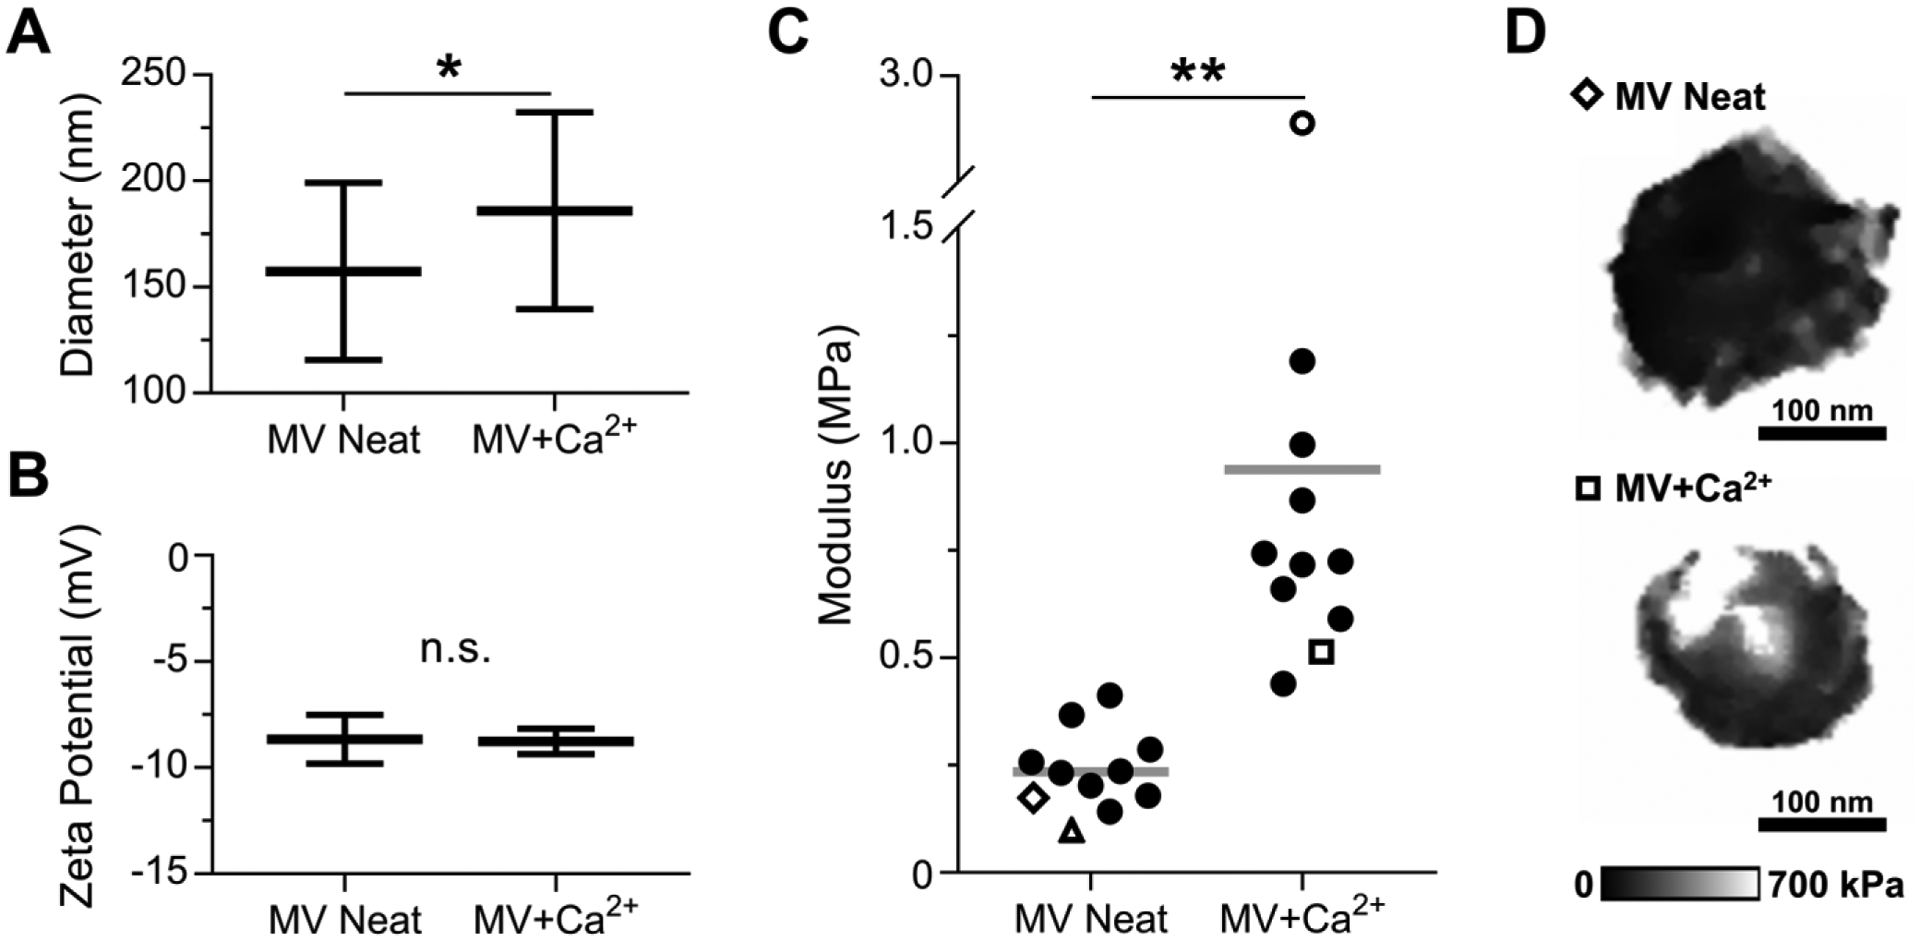
Figure 2.

Characterization of NC mineralization by DLS and AFM-PFQNM measurements of hydrated MVs. MVs were incubated in SCL devoid of Ca2+ (MV Neat) or supplemented with 2 mM Ca2+ (MV+Ca2+) for 24 h. (A) Hydrodynamic diameter (n = 25 measurements per group) and (B) zeta potential (n = 10 measurements per group) of MV samples. (C) Elastic modulus data calculated from AFM micrographs of individual vesicles acquired in PFQNM mode (n = 11 vesicles per group, data calculated from loading curves). Each marker corresponds to the average elastic modulus of a single MV and the horizontal bar is the mean of the group. Hollow markers correspond to individual MVs shown here and in Figure 3. (D) Modulus maps of representative individual vesicles.
