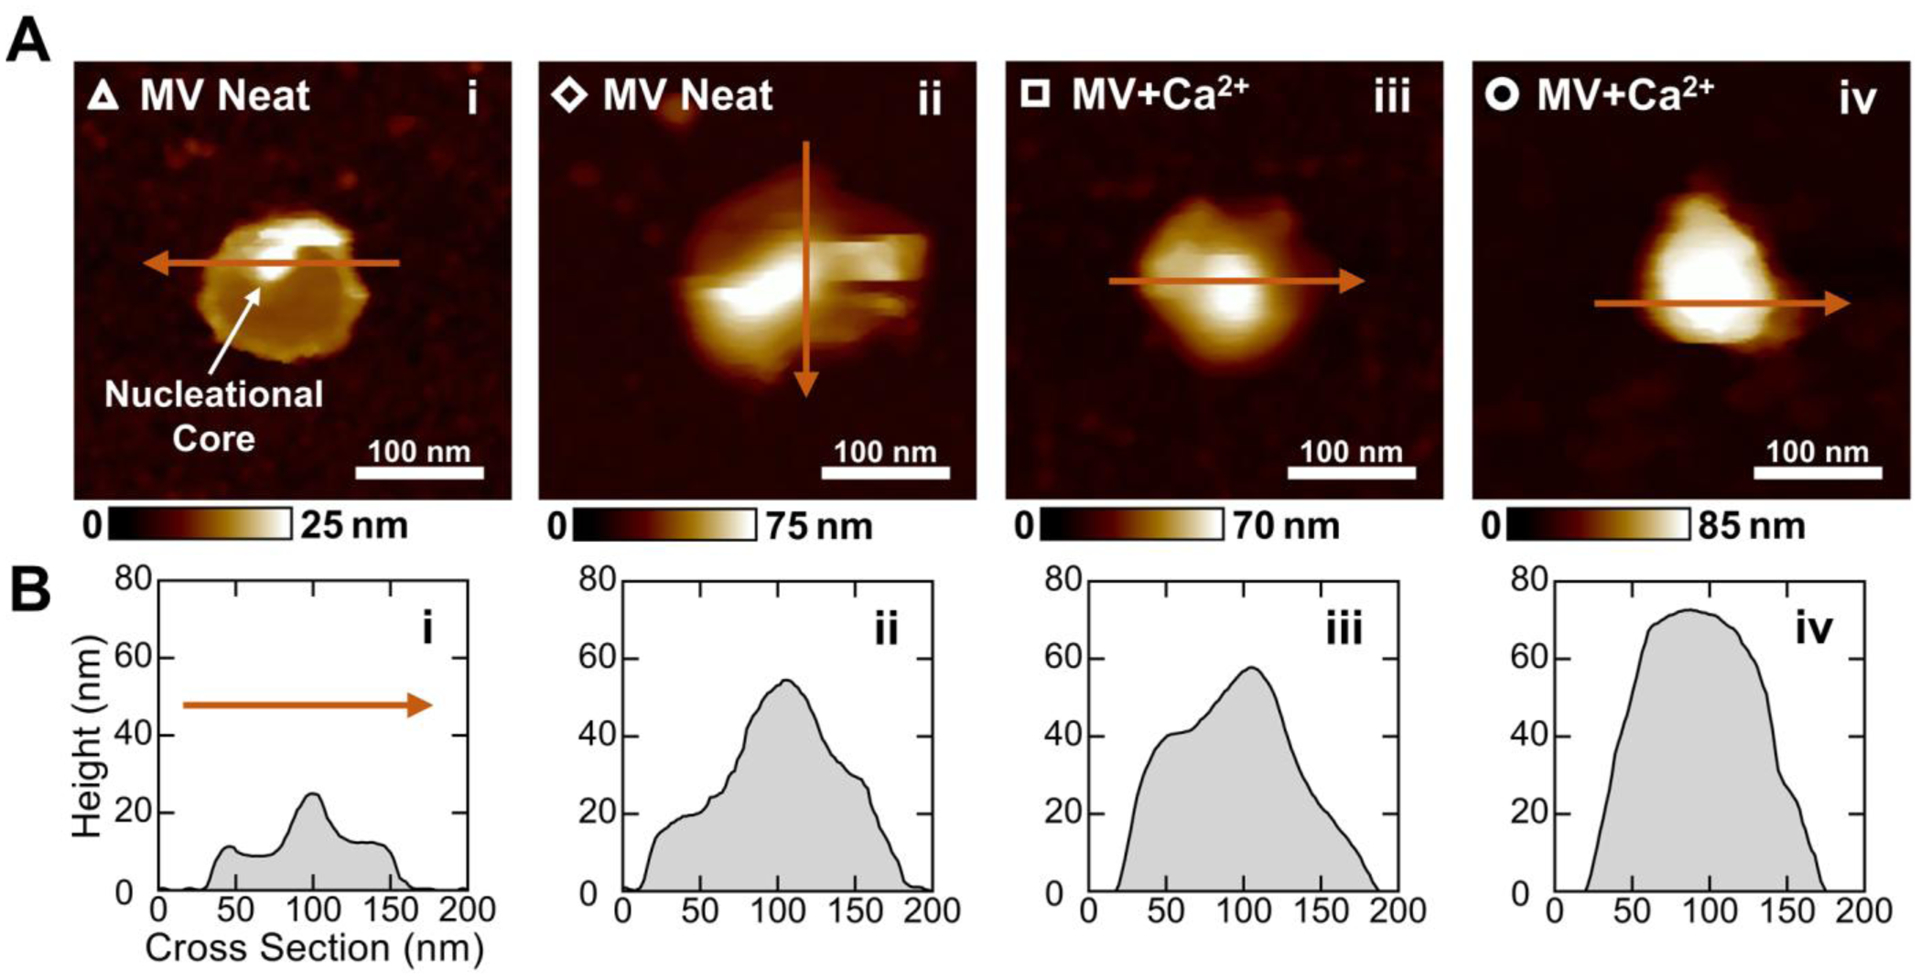
Figure 3.

Morphological characterization of different MVs before and after mineralization by AFM-PFQNM. (A) Height maps of representative MVs arranged in the order that mineralization is expected to proceed. The hollow markers correspond to the elastic modulus data points in Figure 2C. An intense peak believed to be the NC is indicated in panel i. (B) Two-dimensional cross sections of MVs taken across the maximum height of each vesicle. The arrows in (A) show the direction of each cross-sectional measurement.
