FIGURE 3.

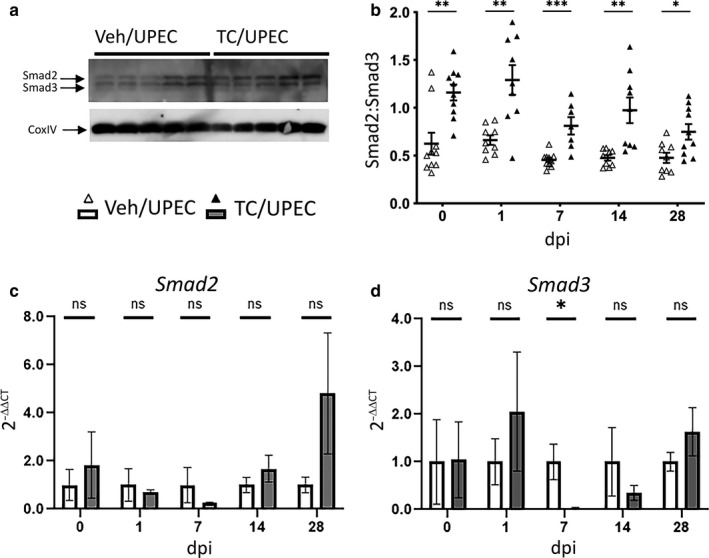
TC treatment alters the Smad2:Smad3 ratio throughout the course of infection. The ratio of Smad2 and Smad3 was determined by immunoblot (as exemplified with five individual vehicle‐ and TC‐treated mice 14 dpi) in panel (a) and quantified in (b), at the time of UPEC inoculation and at 1, 7, 14 and 28 dpi in whole‐kidney homogenates from vehicle‐treated mice (open triangles) or TC‐treated mice (filled triangles); n = 7–10 mice per group. The relative mRNA expression of (c) Smad2 and (d) Smad3 in whole kidney (normalized to Gapdh) was determined at the above time points in both vehicle‐treated (open bars) and TC‐treated (gray bars) mice; n = 4–8 mice per group. *p < .05, **p < .01, ***p < .001
