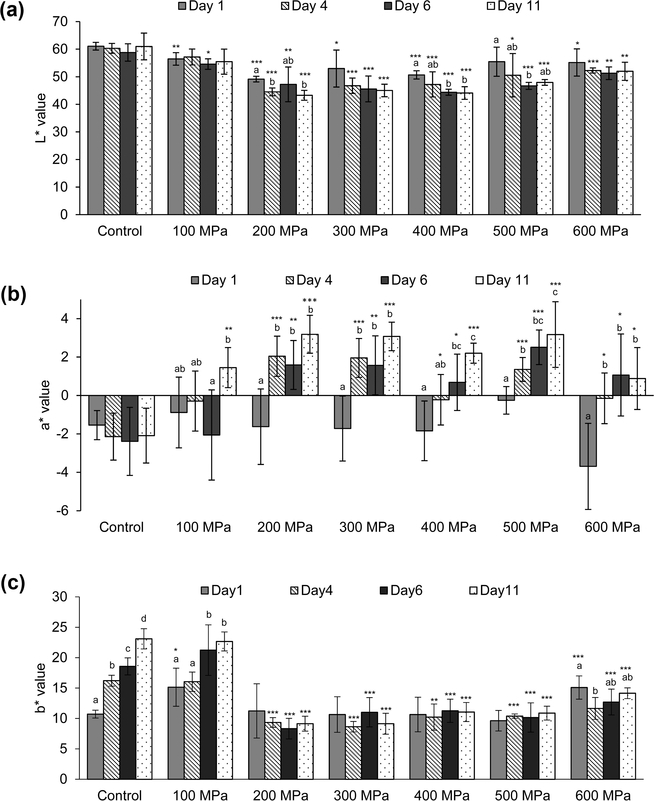
Figure 2.
Effects of storage on the (a) L*, (b) a*, and (c) b* values of HP-treated broccoli sprouts. Control is the raw, untreated broccoli sprouts. The temperature during HPP was 30 ± 2 °C. Asterisks indicate significant differences between the HP-treated samples in comparison to the control sample on the same day (*, p ≤ 0.05; **, p ≤ 0.01; ***, p ≤ 0.001; two-tailed, unpaired t test). Different letters within one treatment indicate significantly different results over time (p ≤ 0.05; ANOVA, followed by S–N–K).

