
Figure 2.
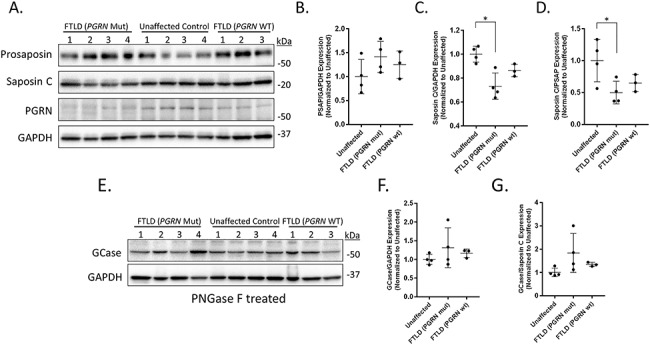
Prosaposin processing is impaired in the cortex of FTLD patients with PGRN mutations. Cortical tissue samples from patients with FTLD (PGRN mutation), unaffected control and FTLD (PGRN WT) were homogenized and examined via western blot analysis. (A) Immunoblots for prosaposin, saposin C, PGRN and GAPDH (loading control). Scatter plots showing quantification of (B) prosaposin and (C) saposin C for the individual cohorts. Relative prosaposin and saposin C expression levels were normalized to corresponding GAPDH values and divided by the mean value obtained from the unaffected samples. (D) The ratio of saposin C to prosaposin was then used for determination of the degree of prosaposin processing in the tissue. (E) Additional homogenate was pretreated with PNGase F prior to western blot analysis for GCase and GAPDH. Scatter plots showing quantification of (F) GCase expression and (G) the correlation of GCase and saposin C. Data are presented as the mean ± SD, n = 4 FTLD (PGRN Mut) and unaffected, n = 3 FTLD (PGRN WT), *P < 0.05, one-way ANOVA followed by Tukeys multiple comparisons post hoc test.