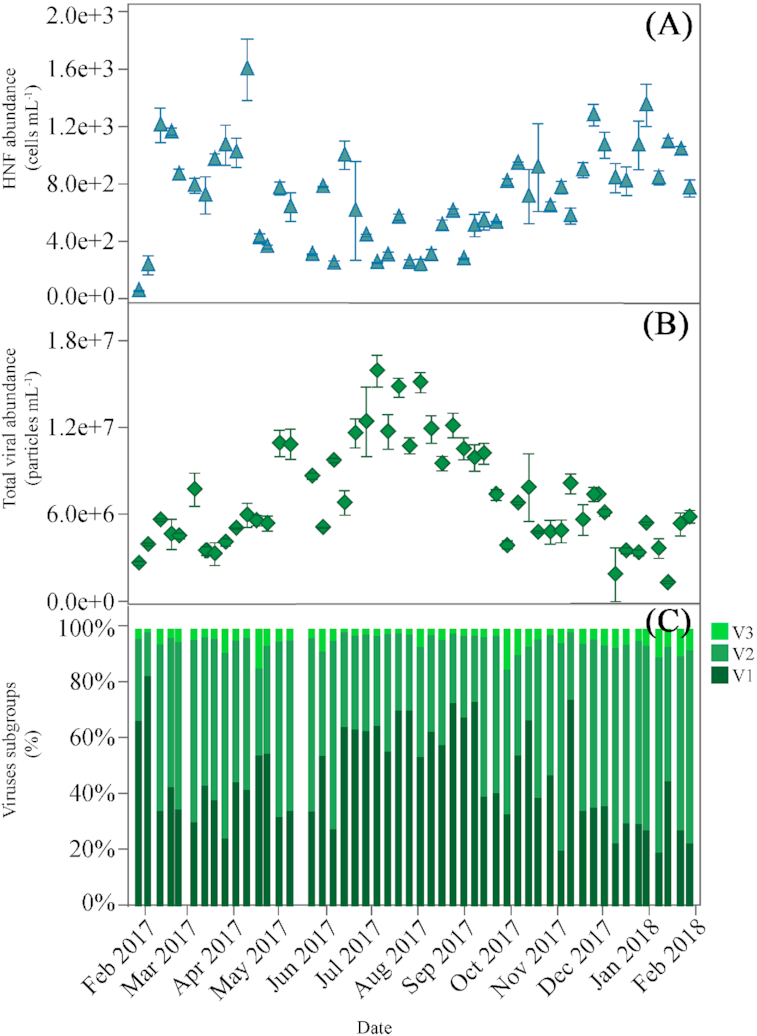
Figure 4.

Weekly variability of the abundance of (A), HNF (mean ± SE cells mL−1), (B), Total viruses (V1+V2+V3) (mean ± SE particles mL−1) and (C), Contribution to total numbers (%) of each of the three subgroups of viruses (V1, V2 and V3) according to their relative nucleic acid content (V1: low, V2: medium and V3: high) at KAUST Harbor station.
