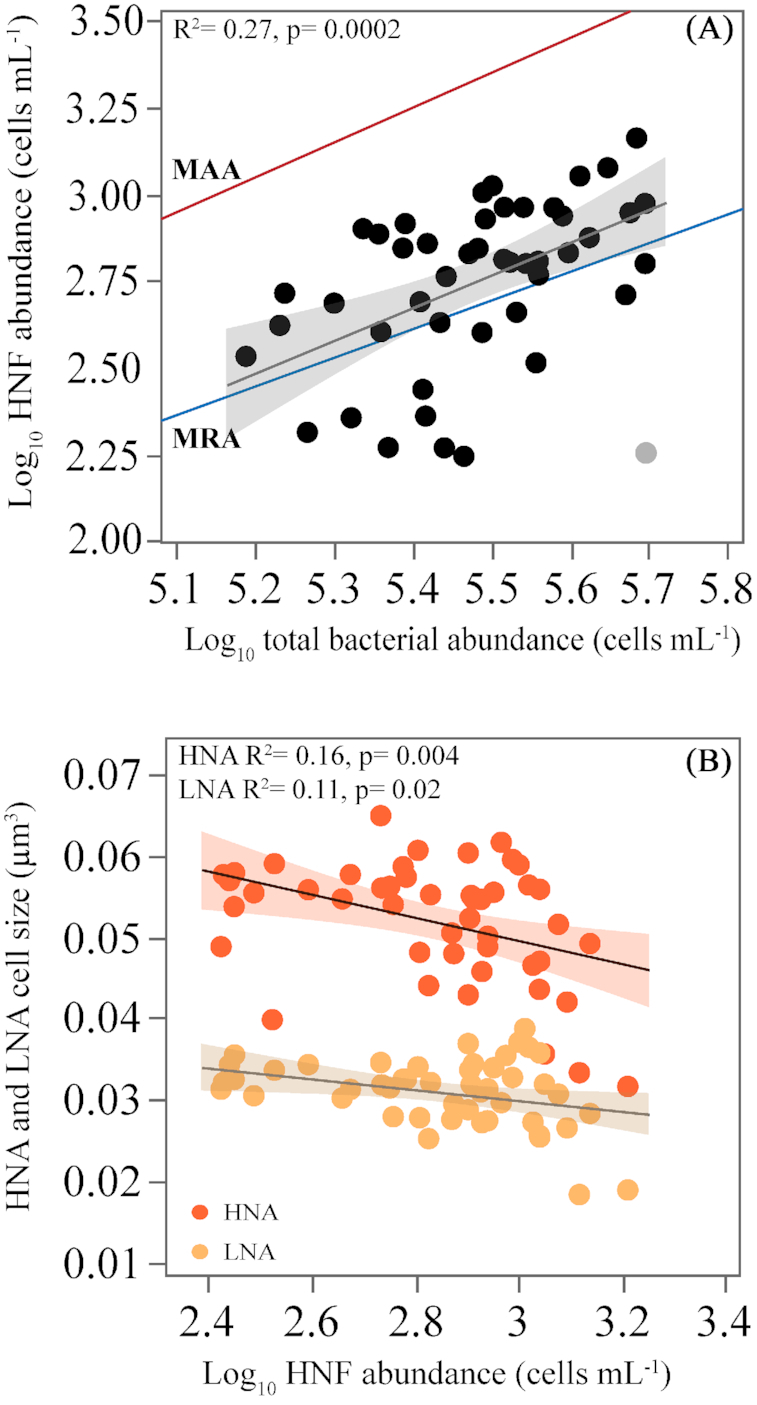
Figure 5.

(A), Relationship between the abundances of heterotrophic nanoflagellates and heterotrophic bacteria, compared with the empirical model by Gasol (1994). MAA is the maximum attainable abundance and MRA is mean realized abundance (see the text for details), (light color symbol is excluded from the regression) and (B), Relationship between the cell size of LNA and HNA and HNF abundance. All abundances are log10 transformed. Fitted lines represent the ordinary least squares linear regressions model.
