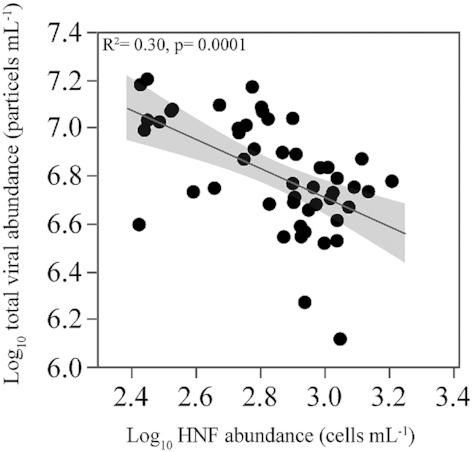
Figure 7.

Relationship between the abundance of heterotrophic nanoflagellates and total viruses for the entire data set. Values are log10 transformed. Fitted line represents the ordinary least squares linear regressions model.

Relationship between the abundance of heterotrophic nanoflagellates and total viruses for the entire data set. Values are log10 transformed. Fitted line represents the ordinary least squares linear regressions model.