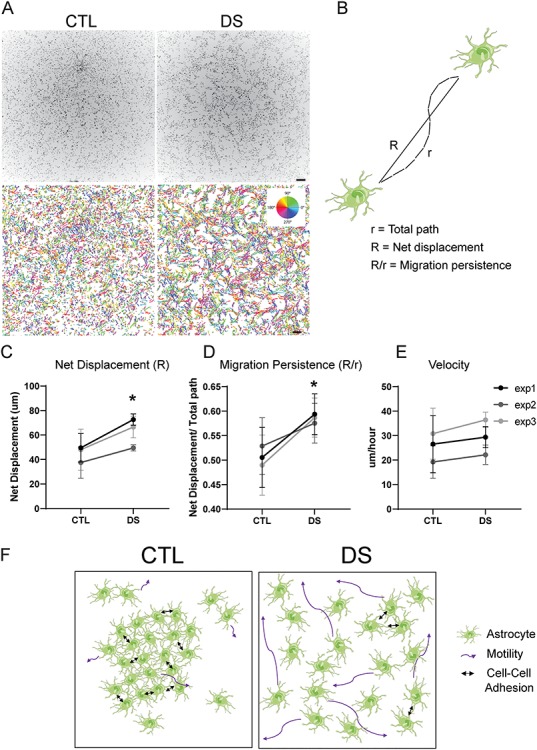
Figure 7.

DS astrocytes have increased cell motility: (A) DS astrocytes have an increased motility at basal conditions, as determined by live imaging and nuclear tracking over 190 min. Automatically detected nuclear trajectories are colored based of the direction of movement (scale bars, 250 μm). (B) Schematic of the measurements used to determine migration persistence: migration persistence (R/r) is measured through the quotient of the net displacement (R) and the total distance travelled (r). (C–E) Over 190 min at basal conditions, DS astrocytes display an increase in net displacement and migration persistence, but not in velocity. (n = 3 independent experiments, in all three CTL and DS cell lines; data are represented as mean ± SEM. Two tailed, paired t-test was performed *P ≤ 0.05 **P ≤ 0.01). (F) Schematic summarizing the results of Figures 6 and 7. DS astrocytes show increased cell size through increased cell spreading, decreased cell-cell adhesion and increased motility.
