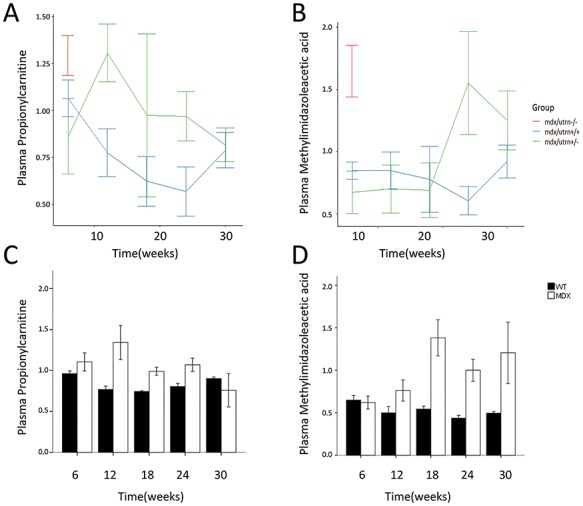
Figure 4.

(A and B). Line graphs of normalized data showing the effect of utrophin dosage on the plasma levels of propionylcarnitine and methylimidazoleacetic acid. (C and D). Corresponding bar graphs showing the change in propionylcarnitine and methylimidazoleacetic acid in mdx mice compared with WT mice.
