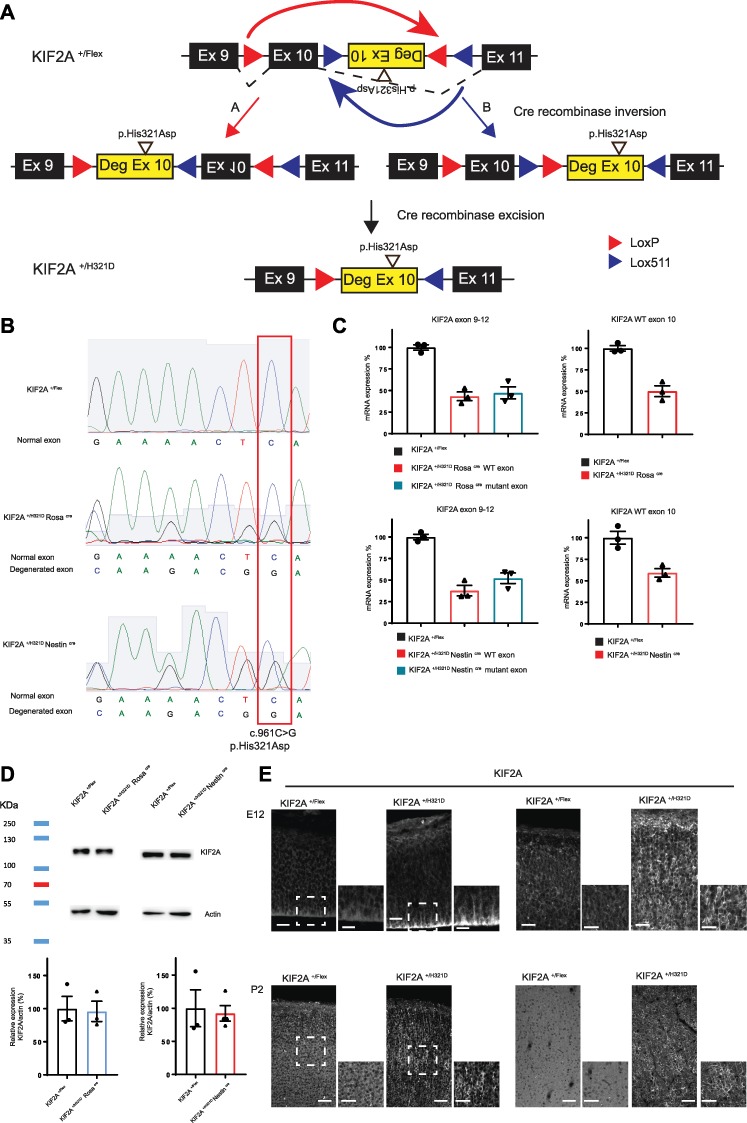
Figure 1.

Generation of KIF2A Flex II mice. (A) Schematic representation of the plasmid construct used for the generation of the KIF2A Flex II mouse model. Mouse exons 9, 10 and 11 are represented as black rectangles. Human degenerated exon 10 carrying the His321Asp variant is presented as a yellow rectangle. LoxP and Lox511 sites are represented as red and purple triangles, respectively. Upper panel depicts the construct before action of the Cre recombinase. Middle panel shows the two constructs resulting from the Cre-induced inversion. Lower panel shows the final construct after excision. (B) Sequencing of cDNA obtained by RT-PCR on cortical extracts from KIF2A +/Flex, KIF2A+/H321DRosaCre and KIF2A+/H321DNestinCre mice showing the presence in KIF2A+/H321DRosaCre and KIF2A+/H321DNestinCre mice of the variant at a heterozygous state. (C) Quantitative PCR analysis of KIF2A levels in cortical extracts from KIF2A +/Flex, KIF2A+/H321DRosaCre and KIF2A+/H321DNestinCre mice, normalized to actin and represented as a percentage of control (n = 3 mice per group). (D) KIF2A protein levels in cortical extracts from KIF2A +/Flex, KIF2A+/H321DRosaCre and KIF2A+/H321DNestinCre mice detected by immunoblotting. Relative quantification of KIF2A protein expression normalized by actin and represented as percentage of control. Data are represented as mean ± SEM, n ≥ 3 mice per group. (E) Coronal sections of embryonic mouse cortices (E12, E15, E18), P2 pups and adult animals stained for KIF2A. Insets delimited with a dotted square show higher magnification of the cortex. Scale bar: E12: 20 μm and 10 μm for zoom, E18: 30 μm and 20 μm for zoom and P2 and adult: 60 μm and 40 μm for zoom.
