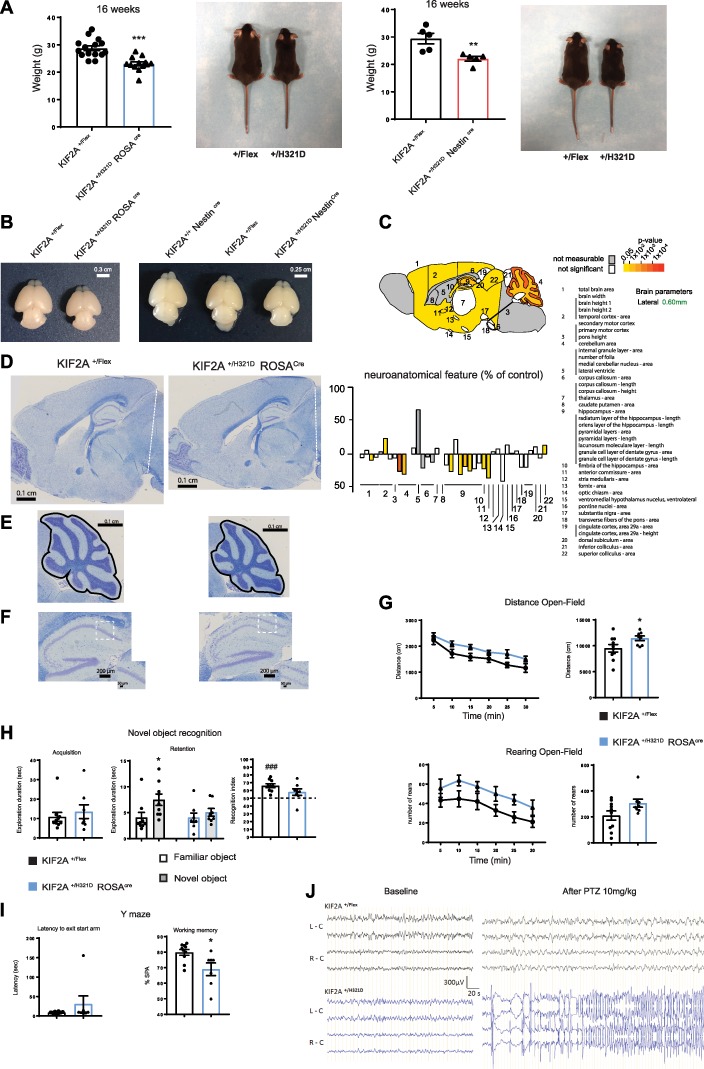
Figure 2.

Adult KIF2A+/H321D mice present with neuroanatomical and behavioral anomalies. (A) Weight and appearance of KIF2A+/H321DRosaCre mice and corresponding controls (left panel) and KIF2A+/H321DRosaCre mice and corresponding controls (right panel). Histograms represent mean ± SEM, from at least five animals per group. (B–D) Sagittal sections from KIF2A+/H321DRosaCre and control mice stained with cresyl violet/luxol blue illustrating brain microcephaly (B, scale bar 0.1 cm); cerebellum atrophy (C, scale bar 0.1 cm) and abnormal organization of the hippocampal pyramidal layer (D, scale bar 200 μm) with insets showing the CA1 region (scale bar 50 μm). (E) Neuroanatomical features of KIF2A+/H321DRosaCre mice. (E) Upper panel: schematic representation of a brain section at lateral +0.60 mm colored according to P-values. Colored regions indicated the presence of at least one significant parameter within the brain region. White coloring indicates a P-value higher than 0.05 and gray shows not enough data to calculate a P-value. Lower panel: Histogram showing variation (decreased—minus scale or increased—positive scale) in areas and lengths expressed as percentage of WT together with a color map indicating the significance level. n = 4 mice per group, unpaired two-tailed t-test. Numbers indicate assessed brain regions listed on the right. (F) Brains from KIF2A+/H321DRosaCre (left panel) and KIF2A+/H321DRosaCre (right panel) P2 pups and corresponding controls. (G–I) Behavioral tests. (G) Open field assay. Locomotor activity is presented by the distance travelled (upper panel) and the rearing activity (lower panel). Graphical representations on the left show activity per 5-min interval. Histograms on the right show total activity during the 30-min session. (H) Novel object recognition test. Histograms represent the time spent exploring the objects during the acquisition (two identical objects) and the retention (one familiar and one novel object) phases. (I) Y maze test. Histograms show the latency to exit the start arm (sec) and the working memory index corresponding to the spontaneous alteration (SPA). Data are represented as mean ± SEM, n = 10 KIF2A+/H321DRosaCre and n = 9 control mice. (J) Representative EEG traces from superficial cortical recordings in KIF2A+/H321DRosaCre and WT mice. Left: EEG recordings before PTZ injection without discharge activity. Right: EEG recordings after 10 mg/kg of PTZ showing a generalized tonicoclonic seizure for KIF2A+/H321DRosaCre animals. L-C: left cortex; R-C: right cortex, n = 3 adult mice per group. ***A: p Value < 0,0001; **B: p Value = 0,0083; *G: p Value = 0,0491; *H: Retention: p Value = 0.0006; ###H: Recognition Index: p Value = 0.0003.
