
Figure 4.
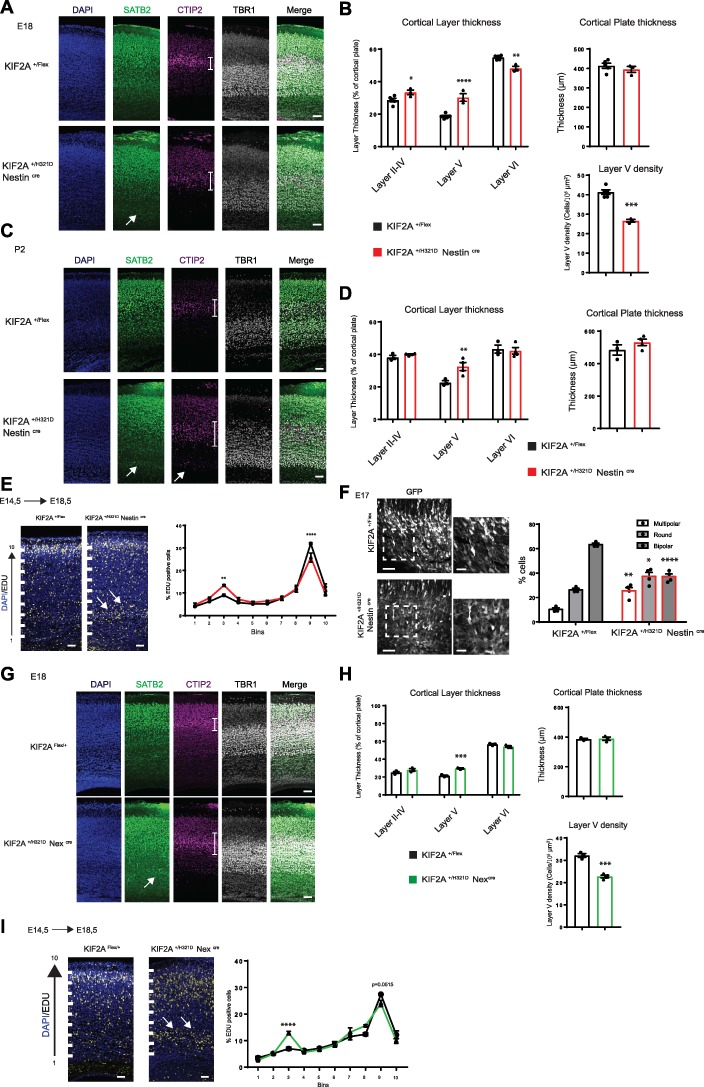
KIF2A+/H321D mice present cortical layering anomalies. (A) Coronal sections of E18 embryonic cortices from KIF2A+/H321DNestinCre and control mice, stained with SATB2 (green), CTIP2 (magenta), TBR1 (gray) and counterstained with DAPI (blue), scale bar 60 μm. White arrow shows SATB2+ cells in the intermediate zone, white lines delimit layer V. (B), Histograms showing relative thickness of layers II–IV, V and VI as percentage if the CP (left), total thickness of the CP (right) and cell density of layer V (lower panel). Data are represented as mean ± SEM, n ≥ 3 mice per group. (C) Coronal sections of P2 cortices from KIF2A+/H321DNestinCre and control mice, stained with SATB2 (green), CTIP2 (magenta), TBR1 (gray) and counterstained with DAPI (blue), scale bar 60 μm. White arrow shows SATB2+ or CTIP2+ cells in the intermediate zone, white lines delimit layer V. (D) Histograms showing relative thickness of cortical layers (left) and total thickness of the CP (right). Data are represented as mean ± SEM, n ≥ 3 mice per group. (E) Coronal sections of E18 embryonic cortices from KIF2A+/H321DNestinCre and control mice, after EdU staining (yellow) counterstained with DAPI (blue), scale bar 30 μm. The cortex was divided into 10 equal bins. White arrows show EdU+ cells accumulation in the intermediate zone. Graphical representation shows the percentage the EDU+ cells in each bin. Data are represented as mean ± SEM, n ≥ 3 mice per group. Scale bar 60 and 30 μm for insets. (F) Coronal sections of E17 embryonic cortices from KIF2A+/H321DNestinCre and control mice, electroporated at E14 with Venus-GFP. Histograms showing percentage of multipolar, round and bipolar cells. Data are represented as mean ± SEM, n ≥ 3 mice per group. (G) Coronal sections of E18 embryonic cortices from KIF2A+/H321DNexCre and control mice, stained with SATB2 (green), CTIP2 (magenta), TBR1 (gray) and counterstained with DAPI (blue), scale bar 60 μm. White arrow shows SATB2+ cells in the intermediate zone, white lines delimit layer V. (H) Histograms showing relative thickness of cortical layers, total thickness of the CP and cell density of layer V (respectively right, middle and left panels) in E18.5 KIF2A+/H321DNexCre embryos. Data are represented as mean ± SEM, n ≥ 3 mice per group. (I) Coronal sections of E18 embryonic cortices from KIF2A+/H321DNexCre and control mice, after EdU staining (yellow) counterstained with DAPI (blue), scale bar 30 μm. The cortex was divided into 10 equal bins. White arrows show EdU+ cells accumulation in the intermediate zone. Graphical representation shows the percentage of the EDU+ cells in each bin. Data are represented as mean ± SEM, n ≥ 3 mice per group. *B: Layer II–IV: p Value = 0.0356; ****B: Layer V: p Value > 0,0001; **B: Layer VI: p Value = 0,0026; ***B: Layer V Density p Value = 0.0001; **D: Layer V: p Value = 0,0054; **E: Bin 3: p Value = 0,0075; ****E: Bin 9: p Value > 0,0001; **F: Multipolar: p Value = 0,0013; *F: Round: p Value = 0,0155; ****F: Bipolar: p Value > 0,0001; ***H: Layer V: p Value = 0,0001; ***H: Layer V Density: p Value = 0,0002; ****I: Bin3: p Value > 0,0001.