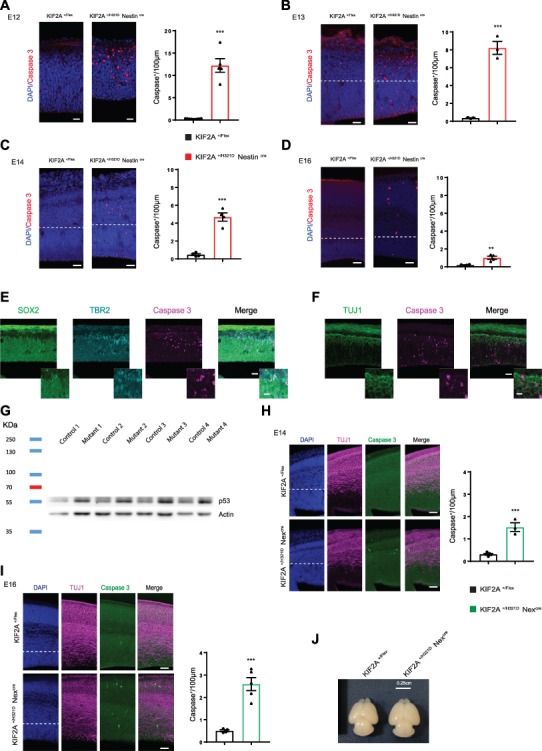
Figure 5.

KIF2A His321Asp variant causes p53-related cell death. (A–D) Immunofluorescence staining of cleaved caspase 3 (red) on embryonic cortices at E12, E13, E14 and E16 (respectively A–D) from KIF2A+/H321DNestinCre and control mice, scale bars A—40 μm, B and C—40 μm, D—80 μm. Histograms show the number of Caspase 3+ cells per 100 μm. Data from at least three embryos per group are presented as mean ± SEM, two-tailed t-test. (E, F) Immunofluorescence staining of SOX2 (green), TBR2 (cyan) and Caspase 3 (magenta) (E); and TUJ1 (green) and Caspase 3 (magenta) (F) on E12 embryonic cortices from KIF2A+/H321DNestinCre and control mice, scale bar 30 and 5 μm for insets. (G) p53 protein expression level in brain extracts from KIF2A +/Flex and KIF2A+/H321DNestinCre embryos a E12 detected by immunoblotting. (H, I) Cell death studies in KIF2A+/H321DNex miceCre. Images show coronal sections of E14 (G) and E16 (H) embryonic cortices from KIF2A+/H321DNestinCre and control mice, stained for Caspase 3 (green), TUJ1 (magenta) and counterstained with DAPI (blue), scale bar: H—60 μm, I—60 μm. Histograms show the number of Caspase 3+ cells per 100 μm. Data from at least three embryos per group are presented as mean ± SEM, two-tailed t-test. (J) Brains from KIF2A+/H321DNexCre and corresponding controls at P2. ***A: p Value = 0.0001; ***B: p Value = 0.0004; ***C: p Value = 0,0001; **D: p Value = 0,0039; ***H: p Value = 0,0002; ***I: p Value = 0,0004.
