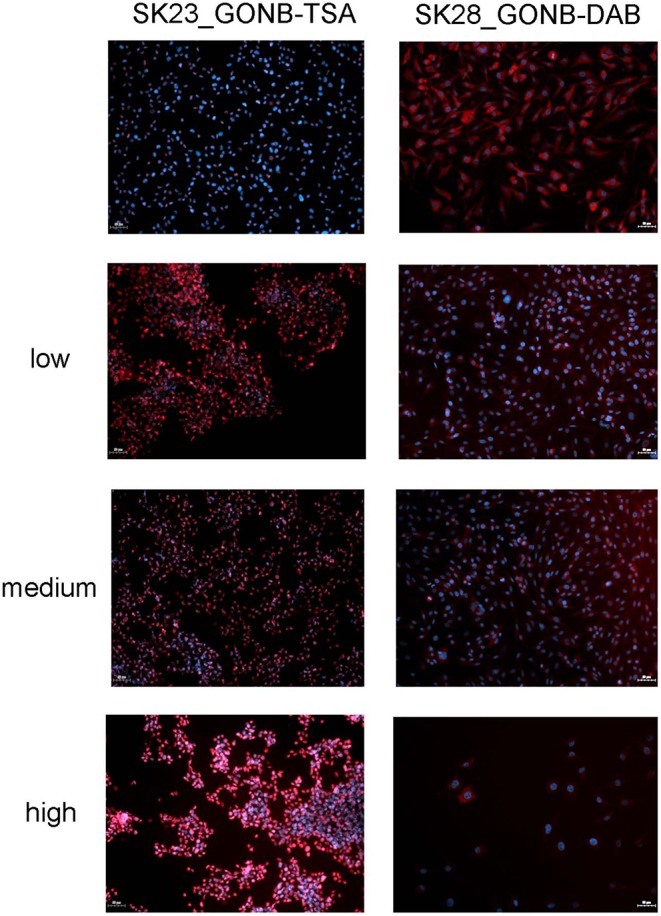
Figure 10.

GONB-DAB and GONB-TSA gradients (from low to high) functionality was tested by immunofluorescence microscopy as in Figures 8, 9, respectively, in comparison with GONB only substrates. Expressions of pERK and acetylated histone H3, respectively are labeled in red while nuclei are labeled in blue (Hoechst). Scale bar = 50 μm.
