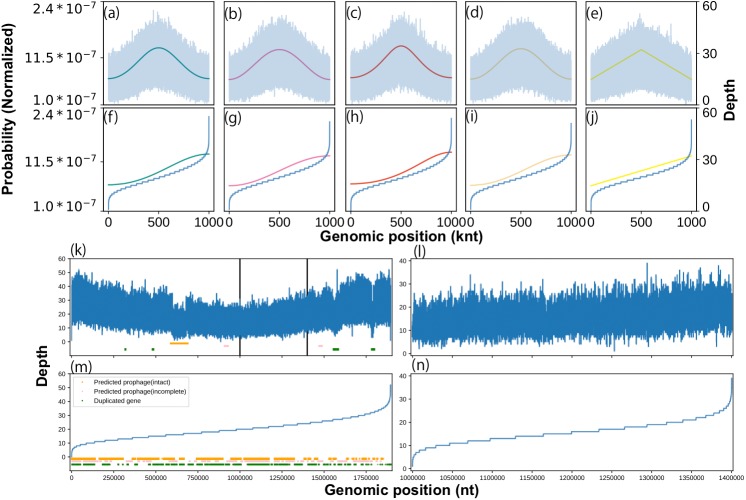
Figure 1. Effects of growth, sequence feature, and outliers on coverage depth shape.
We characterized the coverage depth of chromosomal DNA using statistical models. The shape of the probability distributions (solid lines) and artificial coverage depth (blue lines) obtained using the (A) von Mises, (B) cardioid, (C) wrapped Cauchy, (D) Jones-Pewsey, and (E) linear cardioid distribution model with multinomial distribution. Zero (0) was used as a location parameter, while 0.34657 (von Mises and Jones-Pewsey), 0.16666 (cardioid), 0.17157 (wrapped Cauchy), and 0.1061 (linear cardioid) were used as concentration parameters to align the pPTR with 2.0. The nucleotide number was set to 1 Mnt, and the average coverage depth was set to 20 × in the multinomial distribution. For the Jones-Pewsey distribution, 0.5 was used as the shape parameter. Sorted shapes of the distributions and pseudo-coverage depths from the (F) von Mises, (G) cardioid, (H) wrapped Cauchy, (I) Jones-Pewsey, and (J) linear cardioid distribution model with multinomial distribution. (B) Coverage depth and sequence features that can cause strong noise in the coverage depth of L. gasseri (ERR969426). (K) Overall coverage depth, (L) suspected feature-free region, (M) sorted overall coverage depth, and (N) sorted feature-free region.

