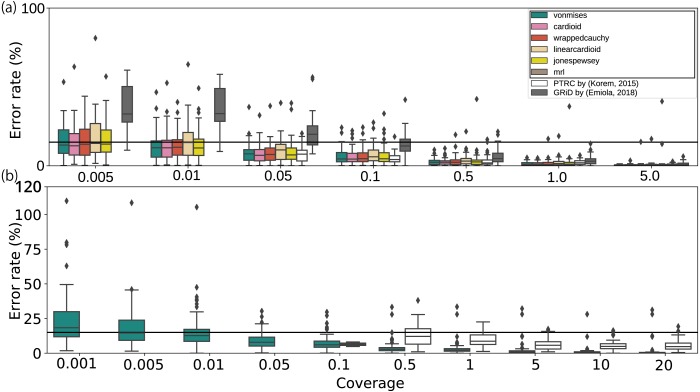
Figure 3. Error rates of growth estimates from various coverage depths with respect to the full coverage depth.
The error rates for each average coverage depth were calculated with respect to the full coverage depth. (A) Only the E. coli, E. faecalis, and L. gasseri WGSs with greater than 5.0× coverage, or (B) species with more than 20× coverage in human fecal WGS datasets were used (Franzosa et al., 2018). The horizontal bar represents the 15% threshold of the error rate threshold. The black crosses on the bar represent the unavailability of the methods with respect to the coverage depth. The proposed models and statistics are shown in the black rectangle within the legend.

