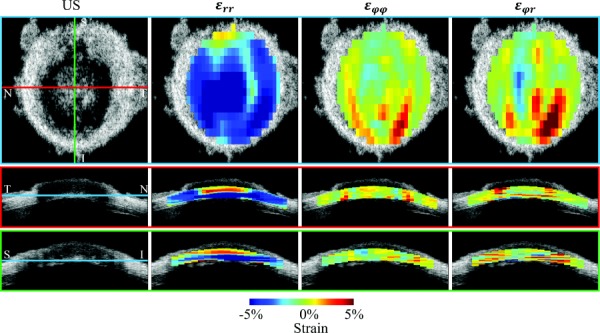
Fig. 6.

Top row shows the strain distribution in a coronal section (en-face view) at a depth indicated by the blue lines shown in the corresponding ultrasound images (US) below. Middle and bottom rows show the transverse views corresponding to the red and green lines in the ultrasound image in the top row. Substantial radial strains appeared to distribute across the cross section and were largely compressive. Meridional strain and shear strain appeared to concentrate in the ONH and PPT conjunction, and through a certain depth. All strains were from a representative porcine eye during inflation from 15 mmHg to 30 mmHg. Strains were plotted at the level of kernels without smoothing.
