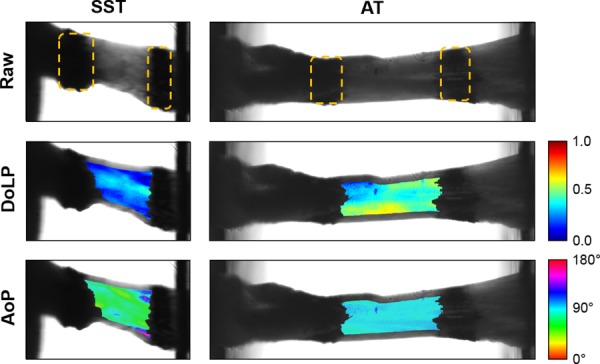
Fig. 1.

Images of a representative SST and AT prior to ramp to failure taken using the QPLI system. The bone is fixed on the left, and the free end of the tendon is clamped on the right. Stain lines, outlined with dotted lines, mark the boundaries of the ROI for analysis of DoLP and AoP. Data are analyzed as groups of pixels, where the AVG DoLP and STD AoP represent the strength of alignment and uniformity of orientation, respectively.
