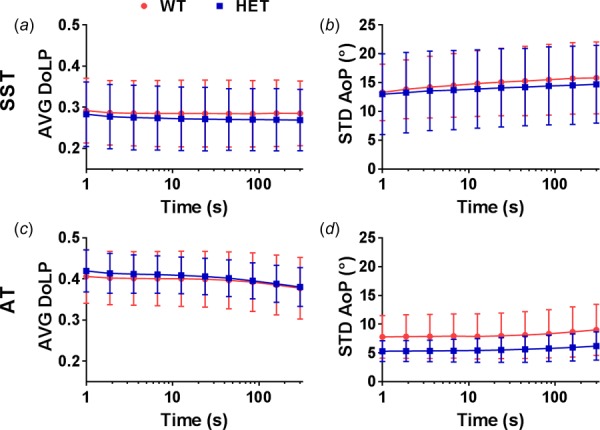
Fig. 6.

Changes in collagen alignment during stress relaxation are represented by AVG DoLP and STD AoP. In both tendons, AVG DoLP decreased (a,c) and STD AoP increased (b,d) as time progressed. There was a trend toward decreased STD AoP in HET ATs compared to WT ATs. Note: The initial time of the test was set to 1 s to allow graphical representation on a logarithmic scale. AVG DoLP y-axes do not start at 0.
