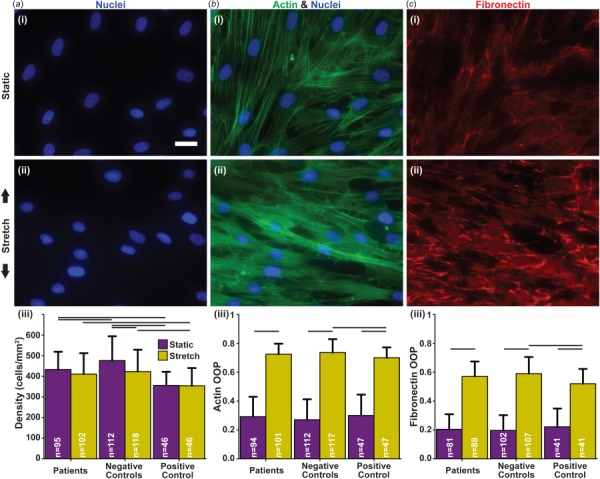
Fig. 1.

Consequences of cyclic strain on cell viability/proliferation and organization. (a) (i–ii) Example images of nuclei stained with DAPI (blue (print: gray)); (iii) cell density estimated by nuclei count. (b) (i–ii) example images of actin stained with Phalloidin (green (print: gray)); (iii) quantification of actin organization. (c) (i–ii) Example images of samples stained for fibronectin (red (print: gray)); (iii) quantification of extracellular matrix organization. (a–c) Scale bar: 25 μm; (i) stains in the static condition; (ii) stains in the stretch condition with black arrows indicating the direction of stretch; (iii) connecting lines represent significances within conditions and between corresponding groups (p < 0.05); sample sizes listed within the bars. Summary of statistical analysis and sample sizes found in Table 1.
