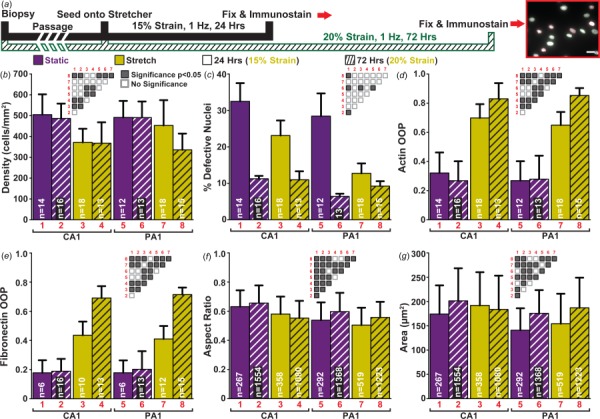
Fig. 3.

Exposure to extensive cyclic strain and its effects: (a) summary of the three different cyclic stretching regimes/experiments (insert scale bar: 25 μm); (b) cell density estimated by nuclei count; (c) percent of defective nuclei; error bars represent the standard error of the mean; (d) quantification of actin organization; (e) quantification of extracellular matrix organization; (f) summary of aspect ratio for all nuclei in each experiment; (g) summary of nuclear area for all nuclei in each experiment. (b)–(g) Static data shown in purple (print: black) and stretched data in yellow (print: gray). Patterns: solid bars for 24 h of 15% cyclic strain and hatch bars for 72-h of 20% cyclic strain; significance matrices of corresponding bars labeled in red (print: gray) (gray boxes p < 0.05, white boxes p > 0.05); sample sizes denoted in white within bars. ((b), (d)–(g)) Error bars represent the standard deviation. Summary of statistical analysis and sample sizes found in Table 2.
