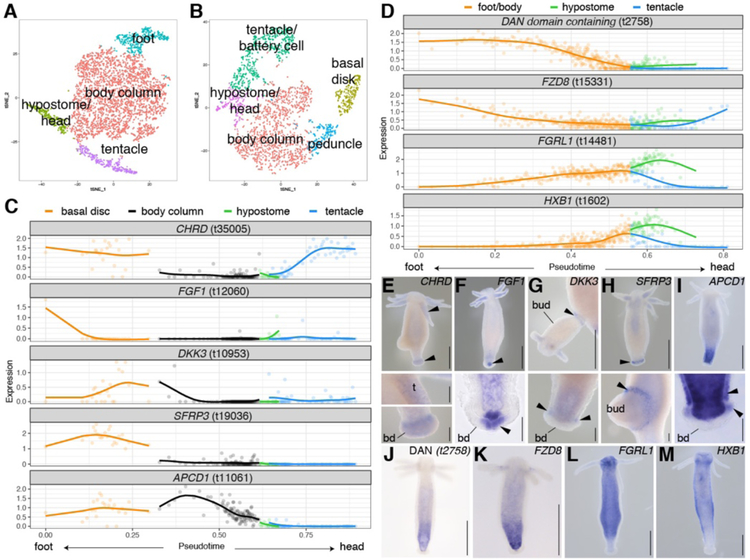
Figure 2. Identification of genes with differential expression along the oral-aboral axis.
A) t-SNE representation of subclustered endodermal epithelial cells and B) subclustered ectodermal epithelial cells. C-D) Epithelial cells were ordered using URD to reconstruct a trajectory where pseudotime represents spatial position. Scaled and log-transformed expression is visualized. C) Trajectory plots for previously uncharacterized putative signaling genes expressed in ectodermal epithelial cells of foot and tentacles. BMP antagonist CHRD (t35005), fibroblast growth factor FGF1 (t12060); Wnt antagonists DKK3 (t10953), SFRP3 (t19036) and APCD1 (t11061). D) Trajectory plots for genes expressed in a graded manner in endodermal epithelial cells. BMP antagonist “DAN domain containing gene” t2758, secreted Wnt antagonist FZD8 (t15331), fibroblast growth factor receptor FGRL1 (t14481), homeobox protein HXB1 (t1602). E-M) Epithelial expression patterns obtained using RNA in situ hybridization consistent with predicted patterns. Whole mounts and selected close-ups. Arrows indicate ectodermal signal. t: tentacle, bd: basal disk. Scale bars: whole mounts (including G): 500 μm, close-ups: 100 μm.

