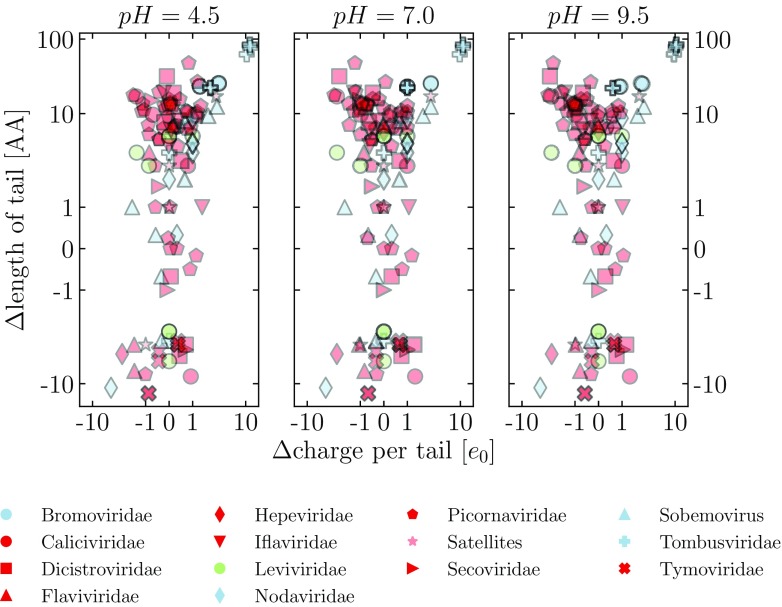
Figure 3.
Difference in the predictions of the length and the average charge on the N-tails as given by the STRIDE assignment of secondary structure and the MD2 prediction of protein disorder. The charge on the tails is calculated at three different values of pH. Blue symbols indicate viral families where N-tails are enriched for clusters of positive charge, and red symbols indicate those where this is not the case (see also the Methods section). In addition, we separately indicate the family Leviviridae (green symbols), the members of which are bacteriophages, and satellite viruses (light red symbols). The same color scheme for the families is used also in other figures in the paper.

