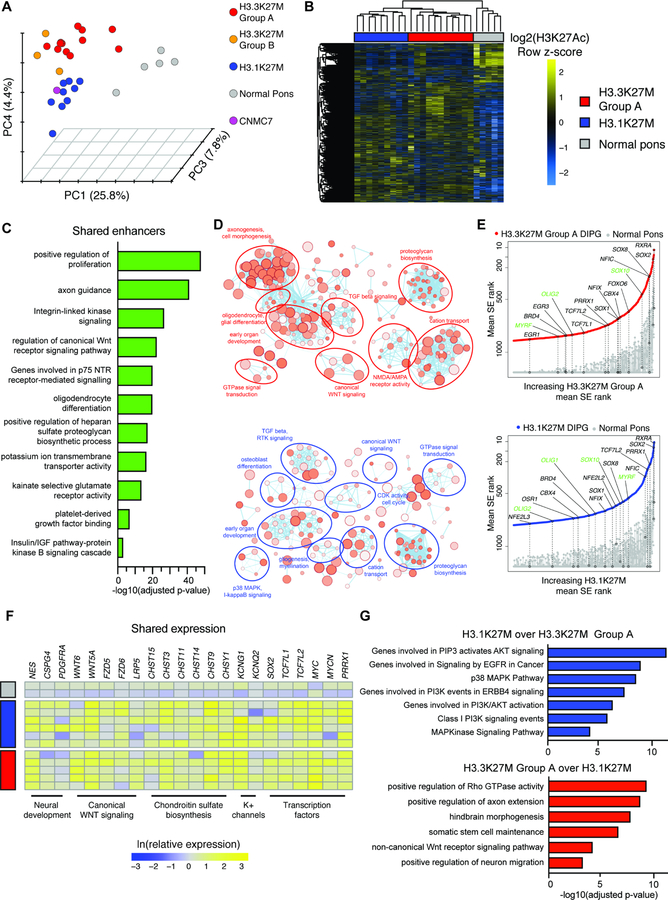
Figure 1. Variant-specific active enhancer landscapes in primary H3K27M DIPG.
A) Clustering of the primary DIPG and normal pontine enhancer landscape. Data shown as principal component analysis (PCA) of H3K27Ac signal at active enhancers. Colors indicate clusters (n = 30 primary human tissue samples; 25 DIPG, 5 non-malignant pediatric pons).
B) H3K27Ac signal in H3.3K27M Group A (n = 11), H3.1K27M (n = 9), and normal pons (n = 3) primary samples at variant enhancers.
C) GREAT analysis of differential enhancers active in both H3.3K27M Group A and H3.1K27M clusters over normal pons.
D) Enrichment map analysis of all genes with mean SE rank in DIPG at least 300 higher than normal pons. Size of circle indicates number of genes and darkness of circle indicates lower p value.
E) SE-associated TFs in DIPG. Y-axis shows mean rank of SE in primary DIPG, ordered on x-axis by increasing mean rank in the DIPG cluster. All genes showing SE mean rank difference of at least 300 were plotted. Circles indicate selected genes shown and green text indicates oligodendroglial lineage genes.
F) Whole tissue RNA-seq of select SE-associated genes, shown as natural log transformed expression relative to average expression in normal pons (H3.3K27M, n = 5; H3.1K27M, n = 6; normal pons, n = 2).
G) GREAT analysis of active enhancers with differential H3K27Ac signal between H3.3K27M Group A and H3.1K27M DIPG.

