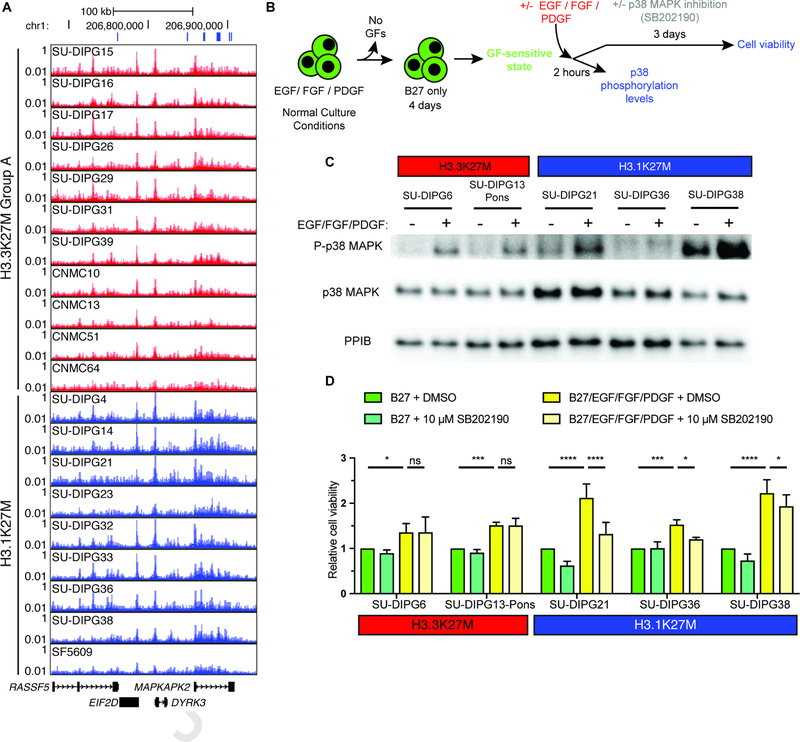
Figure 4. p38 MAPK signaling facilitates cell growth in H3.1K27M DIPG.
A) Differential H3K27Ac signal at p38 MAPK pathway gene MAPKAPK2. X-axis represents genomic location and y-axis represents RPM. Blue bars indicate differential enhancers and promoters activated in H3.1K27M over H3.3K27M Group A DIPG.
B) Experimental paradigm for GF sensitization of DIPG cultures and subsequent studies shown in (C) and (D).
C) Western blot in patient-derived DIPG cultures following treatment with B27 alone (−) or with GFs (+). PPIB shown as loading control.
D) Cell viability of patient-derived DIPG cultures following GF treatment with or without p38 MAPK inhibition (SB202190). Values for each culture are normalized to B27 only + DMSO treated cells (n = 3).
All pooled data shown as mean +/− s.d.; * adjusted p value < 0.1, ** adjusted p value < 0.01, *** adjusted p value < 0.001, **** adjusted p value < 0.0001.

