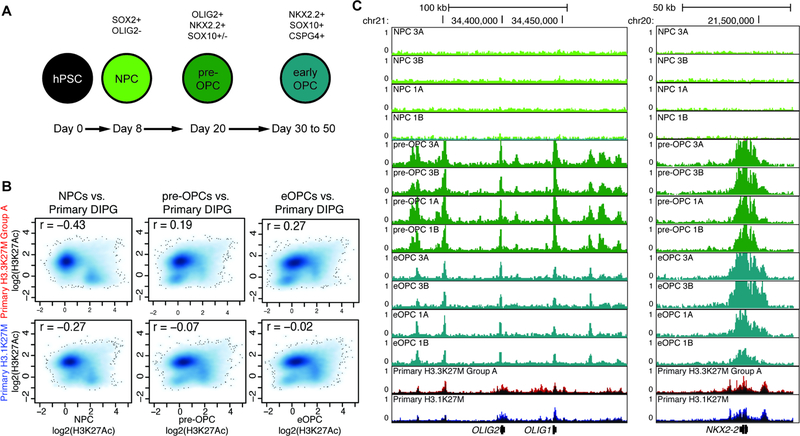
Figure 5. Stage-specific induction of H3K27M indicates an oligodendrocyte-lineage cell of transformation.
A) Schematic for differentiation from human pluripotent stem cells (hPSC) to multipotent NPC, pre-OPC, and eOPC stages.
B) Comparison of H3K27Ac enrichment at all enhancers at each differentiation stage without H3K27M induction. Y-axis shows primary DIPG log2(mean H3K27Ac enrichment) and x-axis shows NPC, pre-OPC, or eOPC log2(mean H3K27Ac enrichment) (n = 2).
C) H3K27Ac genome tracks at oligodendroglial lineage markers OLIG1/2 and NKX2.2. Samples from each primary DIPG group are shown overlaid as a single track. X-axis represents genomic location and y-axis represents RPM.
See Figure S5.

