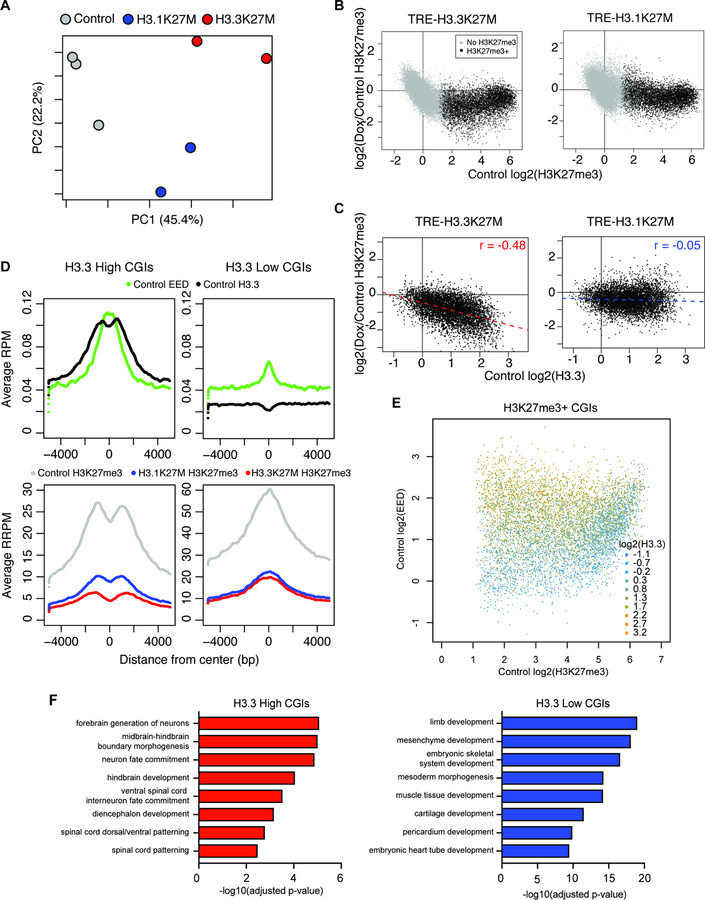
Figure 6. Variant-specific H3K27me3 loss during early H3K27M expression.
A) PCA of H3K27me3 signal at all peaks in eOPCs following 14 days of H3K27M induction.
B) H3K27me3 change at CGIs in eOPCs following H3K27M induction for 14 days. X-axis represents mean log2(H3K27me3 enrichment) in control eOPCs (n = 3) and y-axis represents mean log2(H3K27me3 enrichment change) (n = 2 per H3K27M variant). Black dots represent CGIs with log2(H3K27me3 enrichment) > 1 in all control samples.
C) Correlation between mean H3.3 enrichment and H3K27me3 change at H3K27me3+ CGIs. X-axis represents mean log2(H3.3 enrichment) in control eOPCs and y-axis represents mean log2(H3K27me3 enrichment change).
D) Enrichment plots of ChIP-seq signal at high H3.3 (left) and low H3.3 (right) H3K27me3+ CGIs. Y-axis shows average ChIP-seq signal with H3.3 and EED shown as RPM (top) and H3K27me3 as reference-adjusted RPM (RRPM; bottom).
E) Comparison of mean ChIP-seq singal at H3K27me3+ CGIs in control eOPCs. Color scale indicates level of log2(H3.3 enrichment), x-axis shows log2(H3K27me3 enrichment), and y-axis shows log2(EED enrichment).
F) GREAT analysis on high H3.3 and low H3.3 H3K27me3+ CGIs.
See Figure S6.

