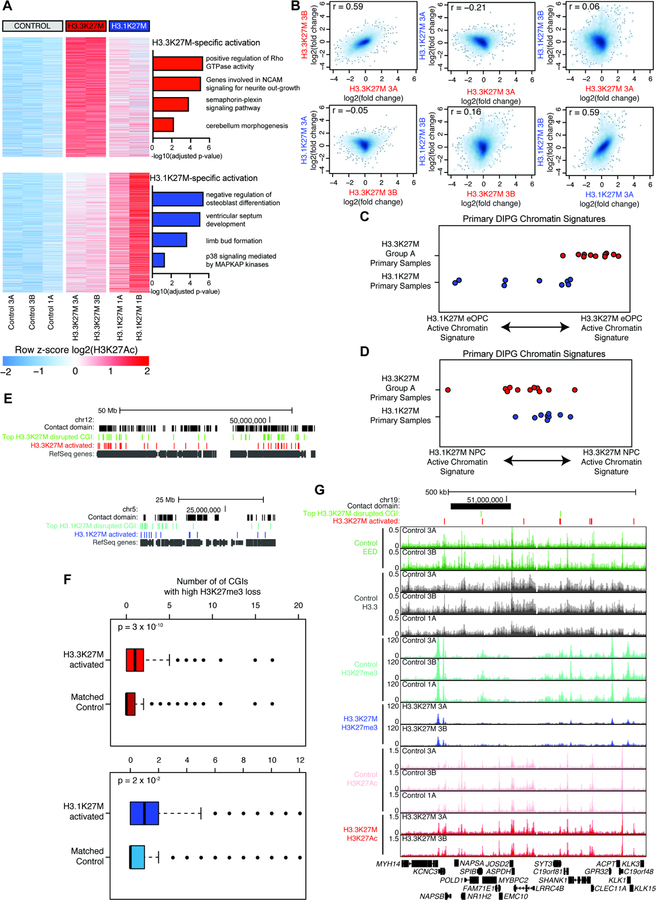
Figure 7. Each H3K27M variant is sufficient to establish distinct profiles of active chromatin that parallel primary DIPG.
A) Top H3K27Ac changes following 25 days of H3K27M expression in eOPCs. Upper heatmap shows enhancers and promoters activated by H3.3K27M only and bottom heatmap activated by H3.1K27M only, ordered by average difference in enrichment. GREAT analysis of each set of regions shown to right.
B) Comparison of transcriptional change for each H3K27M subclone after 25 days of expression. Each axis shows RNA-seq log2(fold-change over control eOPCs) for the doxycycline treated eOPC subclone indicated.
C) Primary DIPG sample scores for H3.3K27M eOPC vs. H3.1K27M eOPC signatures. Plotted value is difference between H3.3K27M and H3.1K27M active chromatin scores for each primary sample.
D) Primary DIPG sample scores for H3.3K27M NPC vs. H3.1K27M NPC signatures. Plotted value is difference between H3.3K27M and H3.1K27M active chromatin scores for each primary sample.
E) Distribution of H3K27me3 loss and H3K27Ac gain. Contact domains represent locally associated regions of chromatin contact. Top CGIs represent top ~2500 for each oncohistone. H3K27M activated regions represent variant-specific regions shown in panel (A). All RefSeq annotated genes are shown in gray.
F) Boxplot showing number of H3K27me3+ CGIs with high H3K27me3 loss associated with the same contact domain as each H3K27Ac peak set. Activated peaks are shown in (A) and controls are a signal-matched peak set. P-value from Mann-Whitney nonparametric test.
G) Representative genome tracks showing H3K27me3 loss and H3K27Ac gain. Red bars show regions with H3K27Ac activation from panel A (top). Y-axis shows RRPM for H3K27me3 and RPM for all other ChIP-seq tracks.
See Figure S7.

