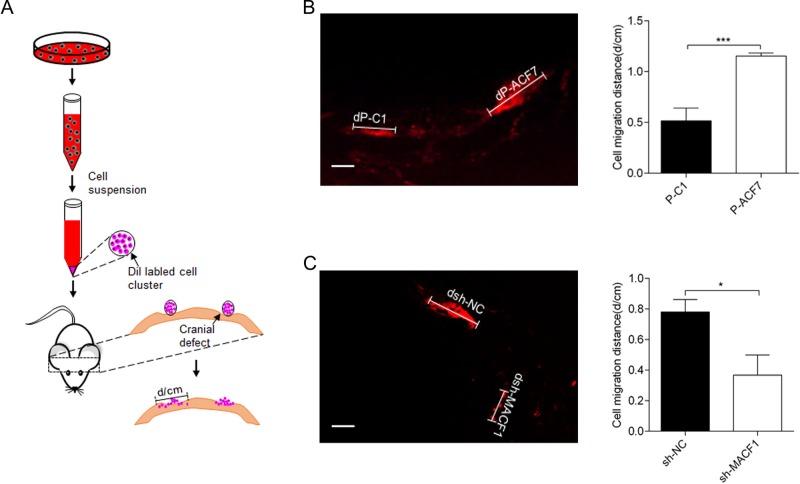
Fig. 2.
MACF1 promotes MC3T3-E1 preosteoblast migration in vivo. (A) Schematic diagram of cell implantation method. (B,C) Migration distance was measured 2 weeks after cell implantation, (B) MACF1 overexpression MC3T3-E1 cell (dP-ACF7 compared to control dP-C1) (n=8), (C) MACF1-knockdown MC3T3-E1 cell (dsh-MACF1 compared to control dsh-NC) (n=8). Representative pictures and quantification of migration distance are shown. Mean±s.d. Scale bars: 200 μm, *P<0.05, ***P<0.001.

