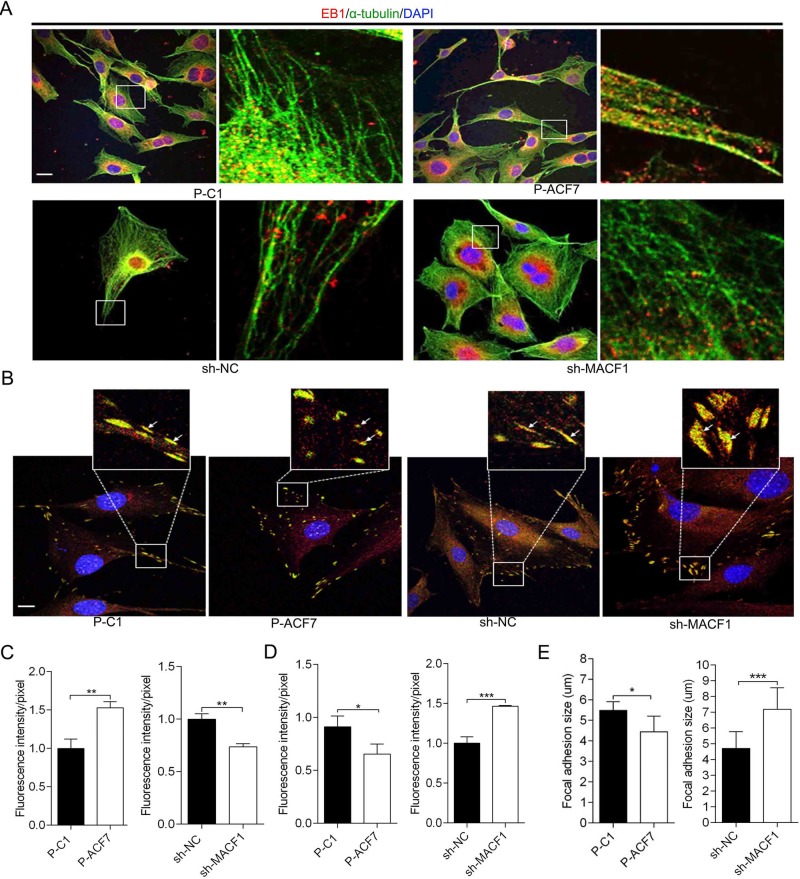
Fig. 4.
MACF1 influences EB1 localization on MT bundle and FA (focal adhesion). EB1 distribution on MT bundle (A) and FA complex (B) in MC3T3-E1 cell are visualized by immunofluorescence staining. The white arrows indicate the distribution of EB1 on FA complex. Quantification analysis of the distribution of EB1 on MT bundle (C) and FA complex (D) in MC3T3-E1 cells. (E) Quantification analysis of FA size in MC3T3-E1 cell (n=50, mean±s.d.). Representative pictures are shown. Scale bars: 50 μm. *P<0.05, **P<0.01, ***P<0.001.

