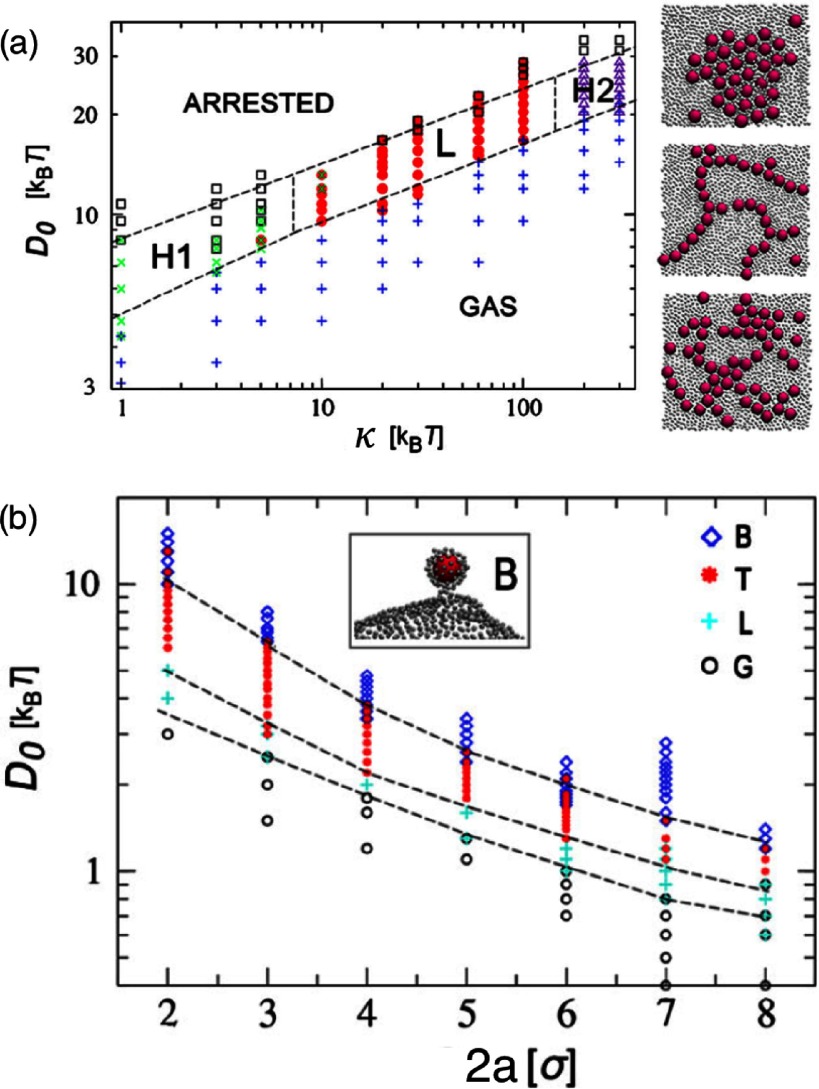
Figure 45.


Membrane-mediated interactions between many particles. (a) Phase diagram for nanoparticle self-assembly in terms of membrane bending rigidity κ and particle-membrane binding energy D0, which replaces the adhesion strength w in the simulations. The snapshots show typical aggregates in the H1, the L, and the H2 phase (top to bottom). Adapted with permission from [203]. Copyright (2012) by the American Physical Society. (b) Phase diagram in terms of nanoparticle diameter and D0. With increasing D0, the gaseous phase G with non-attached particles is followed by the linear aggregation phase L, the tube-formation phase T, and the single-particle bud phase B. The radius of the vesicle is and the particle surface fraction is 0.15. Adapted with permission from [47]. Copyright (2012) by the American Physical Society.

