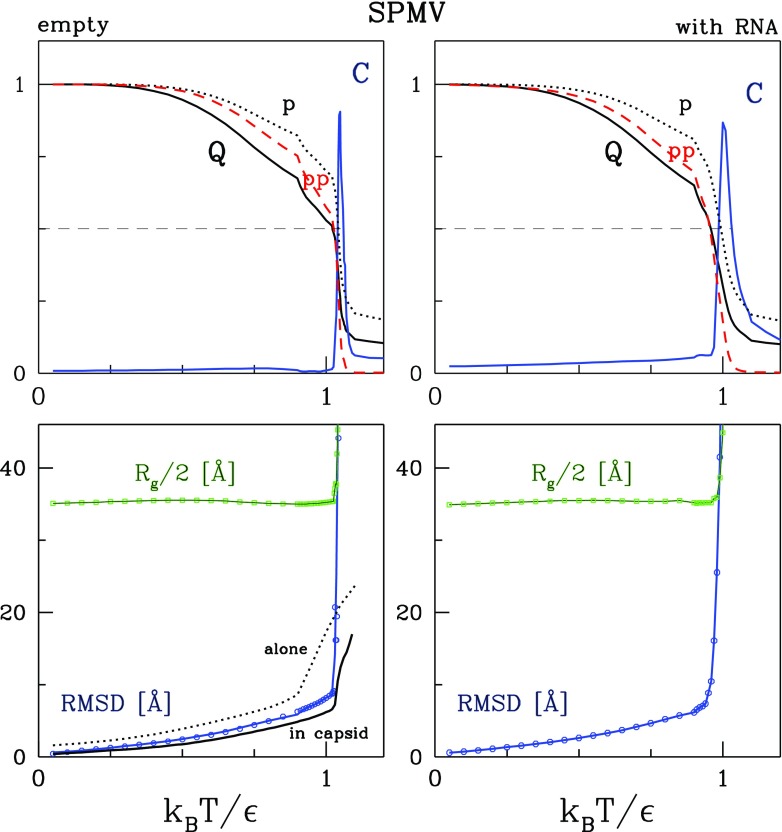
Figure 2.
The temperature dependence of the equilibrium parameters describing the SPMV capsid (empty capsid in the left panels and encompassing the RNA in the right panels). The top panels show the normalized specific heat (in blue), Q (in black), (in black), and Qpp (in red). The dashed lines indicate the level of . The bottom panels show Rg and RMSD. The bottom left panel also shows the RMSD for a single protein when studied alone (the dotted line) or as a part of the capsid (the solid black line).

