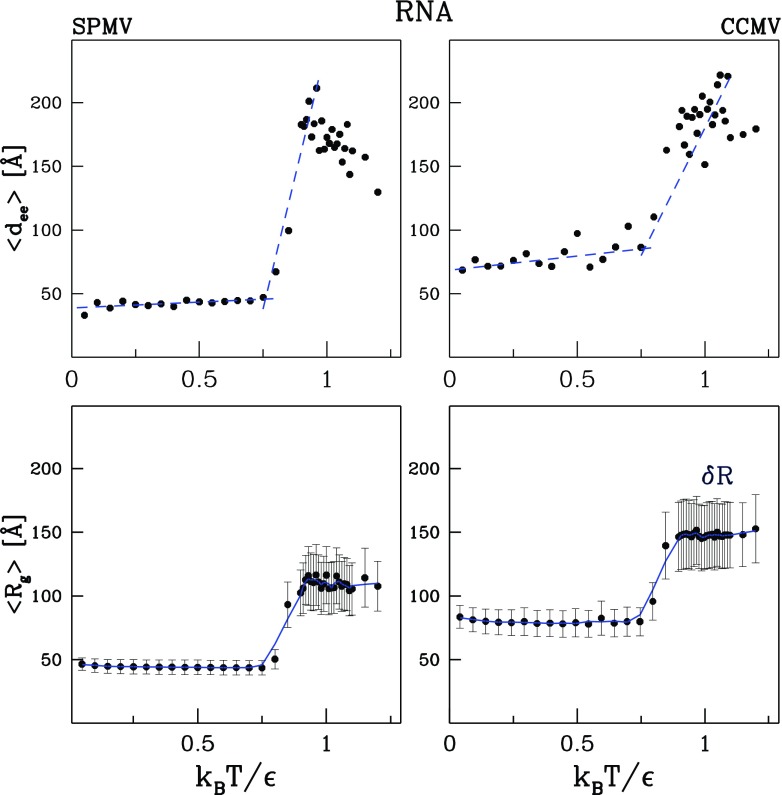
Figure 4.
Characterization of the RNA molecule in the model SPMV (the left panels) and CCMV (the right panels) capsids. The top panels represent the end-to-end distance. The bottom panels show the average radius of gyration and the vertical bars show the width of the distribution of the average distance from the center of mass.

