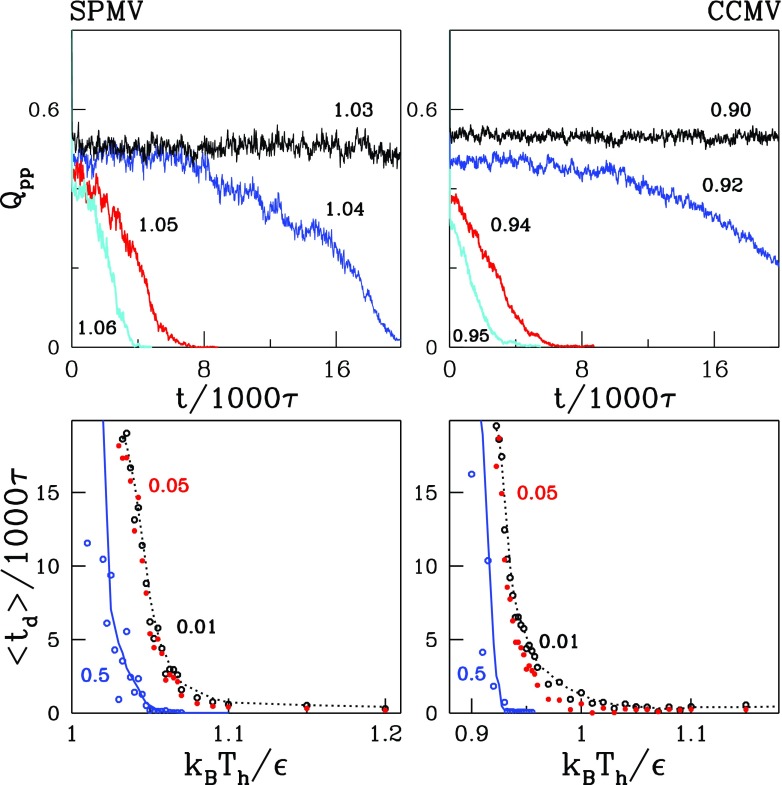
Figure 7.
The top panels show the time dependence of Qpp during heating, on the left for SPMV and on the right for CCMV. The numbers indicate the values of Th in units of . The bottom panels show the average dissociation times for various indicated levels of what is considered to be a successful dissociation.

