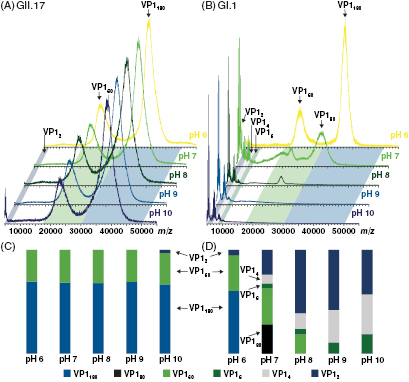
Figure 3.

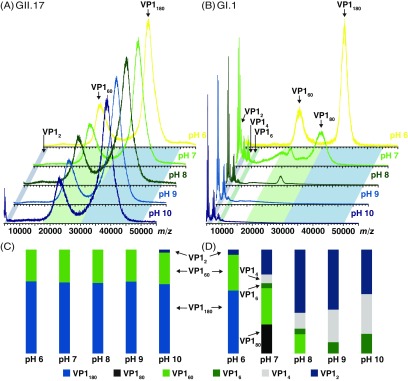
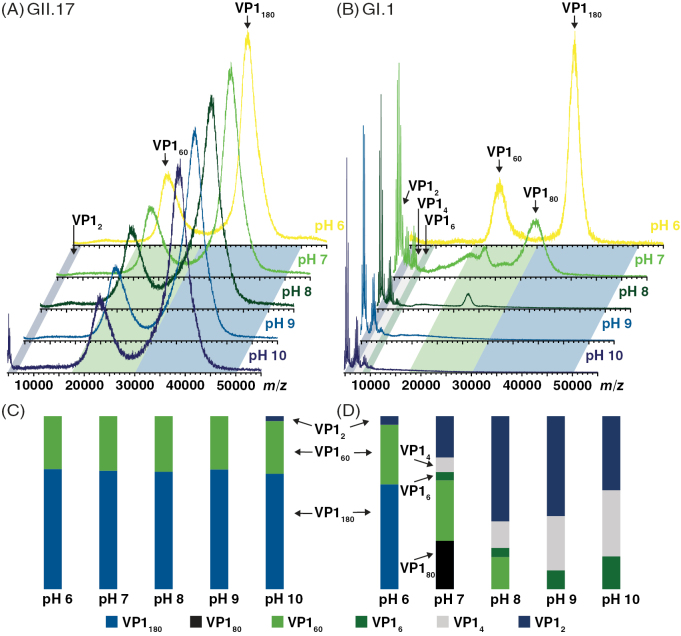
Comparison of norovirus VLP stability monitored by native MS at low ionic strength. Representative mass spectra of norovirus VLPs (10 µM VP1) in 50 mM ammonium acetate at pH values indicated (from top to bottom pH 6–10) (A) mass spectra obtained for the GII.17 Kawasaki virus and (B) for the GI.1 West Chester virus. Data are normalized to the highest peak. Colored inlets indicate the respective m/z range, where intensities were summed for the respective VP1 oligomers. Due to overlapping distributions, the VP1 80 mer falls into the same m/z range as VP1 180 mers, the descriptor therefore changes at pH 7 in (D). The intensity fractions of oligomers are shown for GII.17 Kawasaki (C) and for GI.1 West Chester (D) viruses. Spectra for measurements in 250 mM ammonium acetate can be found in figure S3 of both variants.


