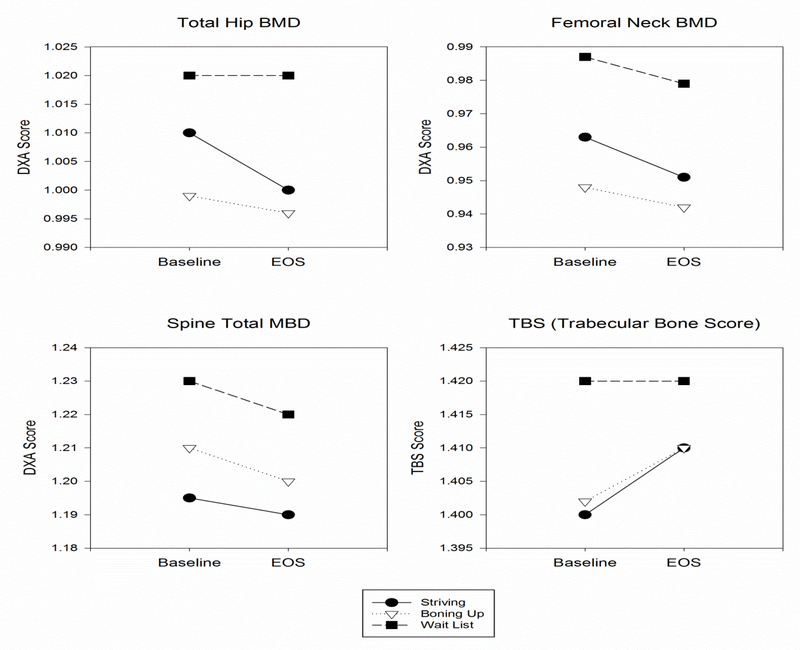
Figure 2:
Graphic Representation of Change in Bone Mineral Density and Trabecular Bone Score over Time and Among Groups
The downward slopes of the lines depict loss of bone mineral density & trabecular bone score between baseline and end of study for total hip, femoral neck, and spine. No difference among the groups occurred as evidenced by none of the lines crossing over time.

