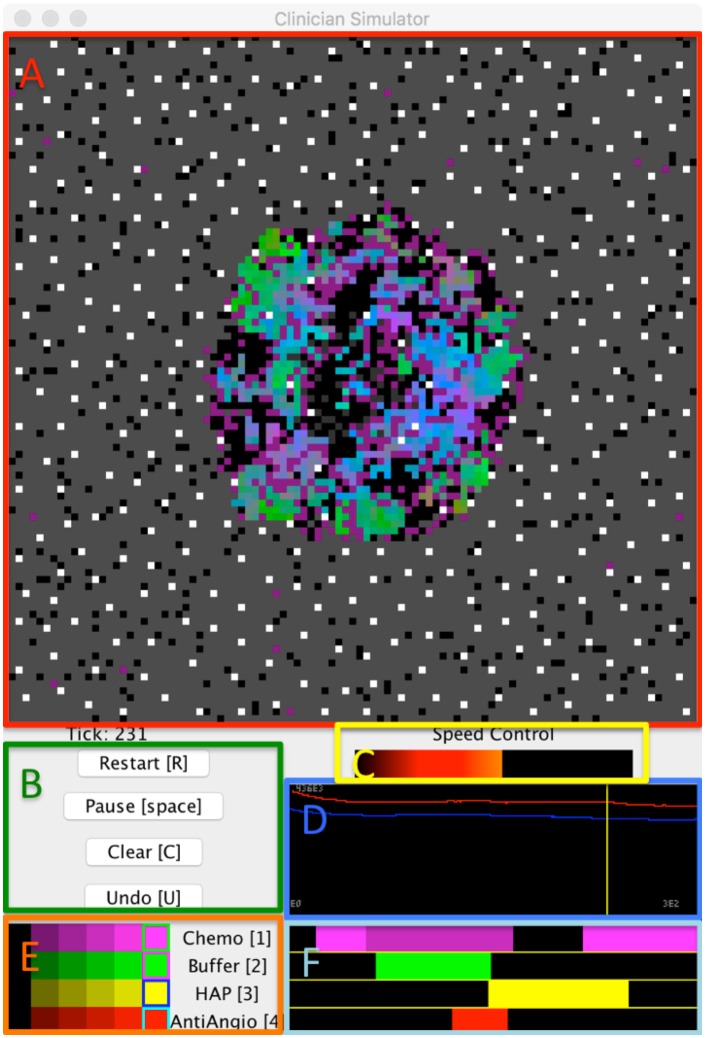
Fig 7. An example of the InteractiveModel object, which allows the modeler to experiment with treatment strategies using a model by Robertson-Tessi et al. [17].
(A) A spatial visualization of the current model state. (B) A control panel of UIButtons allows the user to quickly restart the model, pause execution, clear all treatments, and undo previous changes. Hotkeys for these controls are in brackets. (C) A Speed Control option allows the user to easily adjust the execution speed of the model to range from evaluating as fast as possible to taking a second between timesteps, allowing for careful observation of model dynamics. (D) A timeline that will plot timestep information so that the user may observe aggregate changes over time in response to treatment. The user may also click anywhere in the timeline to backtrack to a previous time point and replay the model from there. The timeline will also automatically backtrack to recalculate any necessary frames when a treatment schedule change is made. (E) A set of sliders that allow the user to select different treatment intensities for each drug. (F) Each horizontal bar parallels the simulation timeline and displays the schedule of a different treatment. Modelers can click on regions within these bars to change regions to a new treatment intensity selected in (E). Modelers may also use the hotkeys presented in (E) to apply the selected intensities in real time as the model runs.

