Abstract
As cancer mortality is high in most regions of the world, early screening of cancer has become increasingly important. Minimally invasive screening programs that use peripheral blood mononuclear cells (PBMCs) are a new and reliable strategy that can achieve early detection of tumors by identifying marker genes. From 797 datasets, four (GSE12771, GSE24536, GSE27562, and GSE42834) including 428 samples, 236 solid tumor cases, and 192 healthy controls were chosen according to the inclusion criteria. A total of 285 genes from among 440 reported genes were selected by meta-analysis. Among them, 4 of the top significantly differentially expressed genes (ANXA1, IFI44, IFI44L, and OAS1) were identified as marker genes of PBMCs. Pathway enrichment analysis identified, two significant pathways, the ‘primary immunodeficiency’ pathway and the ‘cytokine-cytokine receptor interaction’ pathway. Protein- protein interaction (PPI) network analysis revealed the top 27 hubs with a degree centrality greater than 23 to be hub genes. We also identified 3 modules in Molecular Complex Detection (MCODE) analysis: Cluster 1 (related to ANXA1), Cluster 2 (related to IFI44 and IFI44L) and Cluster 3 (related to OAS1). Among the 4 marker genes, IFI44, IFI44L, and OAS1 are potential diagnostic biomarkers, even though their results were not as remarkable as those for ANXA1 in our study. ANXA1 is involved in the immunosuppressive mechanism in tumor-bearing hosts and may be used in a new strategy involving the use of the host's own immunity to achieve tumor suppression.
Introduction
Numerous studies to date have emphasized the importance of early detection in cancer, such that treatment can be initiated as early as possible. Indeed, early detection of cancer is key to successful treatment and patient survival[1, 2].
Early screening is generally performed via testing in individuals with a high risk or high probability of tumor detection in early stages (secondary prevention) or to prevent complications (third-level prevention). The Cancer Screening Program aims to reduce the morbidity and mortality of cancer through early detection of malignant or precancerous lesions. However, the basic ethical dilemma of screening programs is that many people must be exposed to the burden and risk of intervention with little benefits [3]. In fact, the majority of existing screening approaches are invasive. For example, the highest recommended items listed in the US Preventive Services Task Force (USPSTF) Cancer Screening Guidelines (colon cancer and cervical cancer screening) are invasive techniques [4]. Invasive tools are not a satisfactory choice for weak patients, and healthy people with no symptoms are reluctant to undergo these procedures. In addition, most screening programs cannot recognize and diagnose tumors until they develop to a specific extent. As an example, if breast cancer is detected in the breast by palpation or mammography, it may have been present for several years, with the ability to spread to distant organs [5]. Accordingly, there is an urgent need to establish reliable tools for the identification of cancer at early stages, especially prior to the development of clinical symptoms.
Biomarkers have often been deemed an indicator of early tumor screening, and the effectiveness of their intervention in clinical diagnosis and monitoring has been confirmed many times. Early detection of cancer using effective biomarkers can facilitate more effective treatments, allowing patients to have better prognosis[6]. Tumor biomarkers include changes in tumor gene expression-specific mutations or promoter methylation that result in altered protein expression. Biomarkers produced by the tumor itself may be present in the adjacent body fluid or patient's blood circulation system, and this situation leads to a new strategy for establishing a minimally invasive early screening protocol for tumor detection. Furthermore, improvements in genomics and monitoring technologies have provided significant opportunities for cancer screening that make imaging more precise and more specific with regard to describing tumor biomarkers in the blood [7].
Recently, studies have shown that peripheral blood can carry information related to the presence of diseases, including prognosis and treatment response. Compared with existing approaches, cancer detection based on peripheral blood is more advantageous because of the easy accessibility and less invasive procedure for obtaining samples [8]. More importantly, tests based on blood diagnoses can result in better patient compliance for some cancers, such as colon cancer [9].
Peripheral blood mononuclear cells (PBMCs) are composed of immune cells, such as monocytes and lymphocytes. PBMCs are important players in the host immune defense system and can respond to various abnormalities in the host [10]. The development and survival of tumors is a complex process involving interaction between cancer cells, normal stromal cells, and host immune defense systems. The immune evasion mechanism of the tumor itself also has an important role. The main mechanism of tumor immune evasion is immunosuppression in the tumor microenvironment mediated by CD4+, CD25+, and FoxP3+ cells, regulatory T cells (Tregs) and other types of inhibitory cells [11]. Therefore, gene expression profiling of peripheral blood cells has potential in early cancer detection. The experimental results of Michael E. Burczynski et al. indicated that circulating monocytes of peripheral blood can be used as a surrogate monitor for tissues that are difficult to biopsy or a sensitive monitor to check the physiological state of the organism because they can migrate through various tissues of the body [12]. Additionally, Natalie C. Twine identified a group of PBMCs predictive genes that can distinguish between renal cell carcinoma (RCC) patients and normal volunteers with high precision. Furthermore, ongoing research by this group demonstrates that PBMCs from RCC patients can be accurately distinguished from the PBMCs of normal volunteers and also from those of patients with other types of solid tumors [13]. According to the characteristics of these cells, Praveen Sharma et al. showed that PBMCs can be used to develop gene expression-based tests for early detection of breast cancer [14]. The study by Michael K. Showe also suggests that the use of peripheral blood gene expression features to identify early non-small cell lung cancer (NSCLC) in high-risk populations is feasible and may reduce the number of patients who need to undergo biopsy or surgery to determine whether they have benign pulmonary nodules [15].
The rationale for using the PBMC transcriptome gene as a monitor for malignant solid tumors is based on the mechanism by which malignant growth causes characteristic changes in the blood biochemical environment. These changes are mostly related to the immune evasion mechanism of the tumor itself and will affect the expression pattern of some genes in blood cells. PBMC transcriptome gene expression is easily extracted as a tumor screening marker. Given their accessibility, PBMCs may provide potential predictive biomarkers in clinical pharmacogenomics [16].
In this study, we investigated solid tumors and selected human PBMC genetic alterations as a new screening program. We believe that blood-based surrogate markers may serve as accessible biomarkers for early detection, diagnosis, prognosis and prediction of cancer treatment outcomes. Here, we summarize the genetic changes in human PBMCs reported in previous work and confirm the feasibility of this new tumor screening project. The tumor types in this study were limited to solid tumors because hematological tumors, such as leukemia and lymphoma, have a certain impact on human peripheral blood mononuclear cell gene expression. The purpose of our study was to identify potential biomarkers of cancer at an early stage. Cases of advanced cancer were not included. Through this study, we hope to find a new approach for the development of a blood-based gene expression test for early cancer detection.
Materials and methods
Selection of microarray datasets for meta-analysis
We performed a detailed and comprehensive search of microarray datasets in the Gene Expression Omnibus (GEO) database of the National Center for Biotechnology Information (NCBI) (http://www.ncbi.nlm.nih.gov/geo/) according to the Preferred Reporting Items for Systematic Reviews and Meta-Analyses (PRISMA) guidelines published in 2009. To maintain objectivity, the data were extracted from the original database search by two independent reviewers, and any discrepancies between the two reviewers were resolved through consultation with a third reviewer. We used the terms "tumor" and "peripheral blood" as the search keywords for this study, and 797 datasets were obtained from the GEO database. We also included datasets containing the following: 1) RNA research; 2) samples from solid tumors; 3) samples not receiving any tumor treatment; and 4) control samples from the peripheral blood of healthy people. We excluded datasets if they contained the following: 1) hematological tumors, lymphomas, and other tumors that can directly affect related genes in peripheral blood; 2) sample sizes less than 10; 3) terminal cancer samples and 4) nonhuman omics studies.
Selection of reported genes
We then performed searches in the PubMed database based on the keywords "tumor" and/or "peripheral blood" to explore published articles. We collated articles using the same inclusion and exclusion criteria as for the GEO analysis. After reading the selected literature, we selected relevant reported genes and generated a table that was used in the meta-analysis to identify common genes. Kyoto Encyclopedia of Genes and Genomes (KEGG) pathway enrichment analysis of these genes was also performed to determine relevant biological functions.
Meta-analysis of microarray datasets
Prior to the meta-analysis, we performed data normalization of the selected datasets using R statistical software (http://www.r-project.org/) to obtain common genes. We summarized the reported genes from the selected datasets, processed the meta-analysis using genes from the normalized datasets and reported genes by using the MAMA, RankProd, affyPLM and CLL software packages in R statistical software. A list of differentially expressed genes (DEGs) was identified based on P-values, and the top ten genes with their corresponding absolute value of P were selected for forest plot analysis to observe differential expression reported in the literature.
GO annotations and KEGG pathway enrichment analysis
Based on the results of the meta-analysis, the most significant DEGs were evaluated by enrichment analyses. Gene Ontology (GO) annotation and KEGG pathway enrichment analyses were conducted to identify the most significant DEGs using the WEB-based GEne SeT AnaLysis Toolkit (http://www.webgestalt.org/option.php) with a significance threshold of false-discovery rate (FDR) less than 0.1.
Protein-protein interaction (PPI) network construction
To obtain a clear understanding of the cellular functions and biological activities of PBMC marker genes in solid tumors, we analyzed the DEGs in the Search Tool for the Retrieval of Interacting Genes/Proteins (STRING, http://string-db.org) database. PPI networks were constructed with a confidence score greater than 0.4 as the significance cutoff value, aiming to offer an overview of the functional protein association networks. Afterward, the acquired data were visualized using Cytoscape software.
Selection of hub genes and modules
CentiScaPe 2.1 was employed to calculate the degree, closeness, and betweenness of the PPI network. We identified hub genes based on the degree of the node. The most important PPI network clustering module was selected in Cytoscape using MCODE software with degree cutoff = 2, node score cutoff = 0.2, k-core = 2, and max depth = 100. The DEGs in each module with an FDR of less than 0.01 were then subjected to pathway enrichment analysis (using STRING) to explore the biological function of each module.
Results
Selecting a microarray dataset associated with solid tumors for meta-analysis
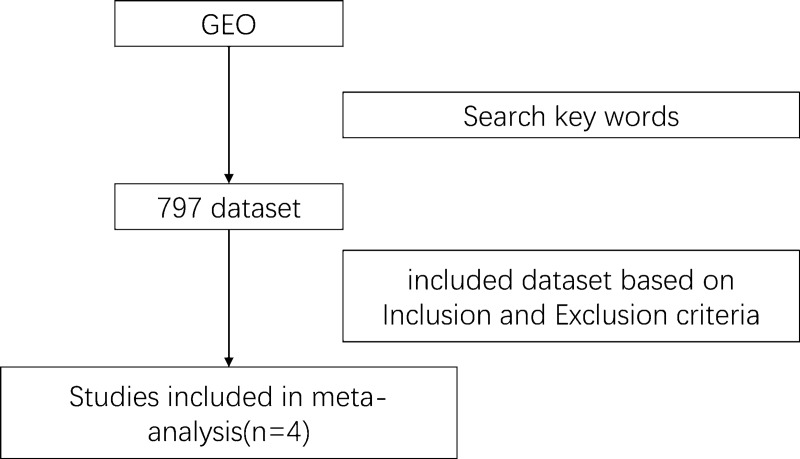
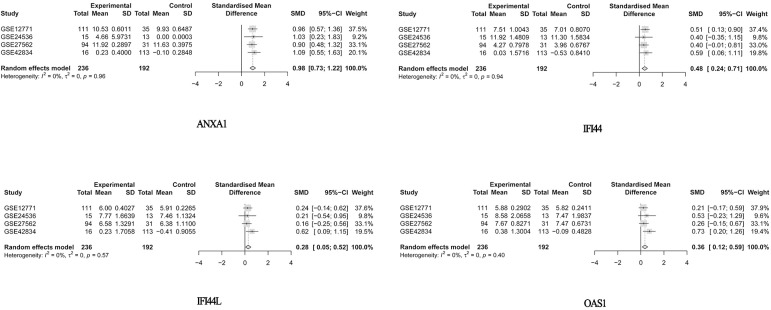
According to the inclusion criteria, four datasets (GSE12771, GSE24536, GSE27562, and GSE42834) including 428 samples, 236 solid tumor patients, and 192 healthy controls were chosen from among 797 datasets (see Materials and Methods and Fig 1). The tumor samples consisted of various types of tumors, including breast cancer, lung cancer, and melanoma. The four GEO series (GSE) all used the microarray dataset from tumor samples and normal control samples (Table 1). We retrieved 8,126 related articles from the PubMed database, which were narrowed down to 28 by applying the inclusion and exclusion criteria. A total of 440 reported genes were found in these articles (S1 Table); the flow chart is shown in Fig 2. As some genes appeared only once, the results were not stable. In the meta-analysis, 285 genes from among 440 reported genes were selected using the MAMA, RankProd, affyPLM and CLL software packages in the R statistical software. (S2 Table), and 20 genes, the top ten with positive and negative absolute P-values were used in forest plot analysis (S1 and S2 Files).Ultimately, 4 genes (ANXA1, IFI44, IFI44L, and OAS1) with significant forest plots were determined as the marker genes of PBMCs (Fig 3).
Fig 1. Flow chart of the processing of microarray dataset selection.
Table 1. Basic information of the four GSE datasets.
Fig 2. Flow chart of the processing of the reported genes selection.
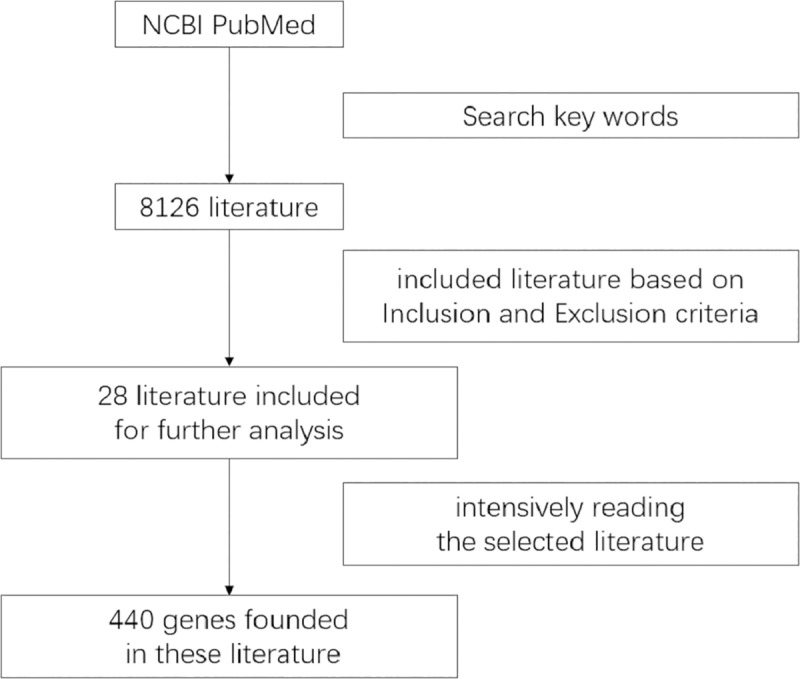
Fig 3. Forest plots of the differential expression levels of the top 4 genes (ANAX1, IFI44, IF44L, and OAS1).
GO and KEGG pathway enrichment analysis
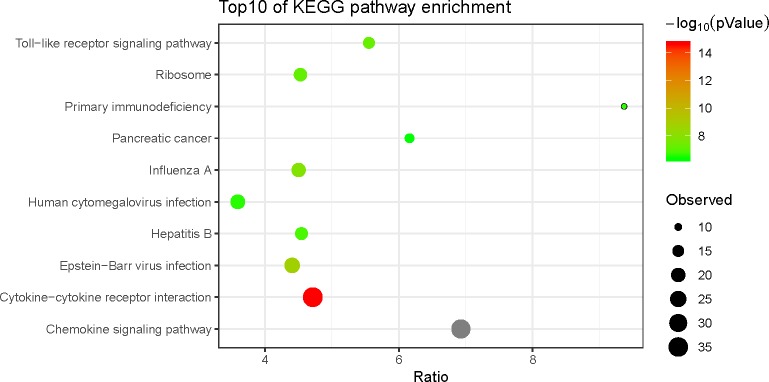
To further investigate the function of the reported genes and DEGs, we performed a KEGG pathway enrichment analysis of 440 genes with a significance threshold of less than 0.1 (Table 2). We also performed biological process functional GO and KEGG pathway enrichment analyses on 285 genes (Table 3) and constructed a channel-enriched bubble chart of the KEGG pathway enrichment analysis using the ggplot2 software package in R software (Fig 4). The bubble chart shows the ratio on the horizontal axis and the path name on the vertical axis, and the size of the bubble represents the observed gene number. The color of the bubble represents the -log10 P-value. Therefore, larger bubbles indicate the detection of more genes in the pathway, and the deeper the bubble color is, the smaller the P-value of the pathway is. We identified two significant pathways and the ‘primary immunodeficiency’ pathway and ‘cytokine-cytokine receptor interaction’ pathway, through this analysis.
Table 2. KEGG pathway enrichment analysis of 440 genes.
| Gene Set | Description | Size | Overlap | Expected | Enrichment Ratio | P Value | FDR |
|---|---|---|---|---|---|---|---|
| hsa04062 | Chemokine signaling pathway | 189 | 34 | 5.086223 | 6.684724526 | 0 | 0 |
| hsa04060 | Cytokine-cytokine receptor interaction | 294 | 36 | 7.911903 | 4.55010661 | 7.99E-15 | 1.30E-12 |
| hsa03010 | Ribosome | 153 | 21 | 4.117419 | 5.100282899 | 5.91E-10 | 6.42E-08 |
| hsa05169 | Epstein-Barr virus infection | 201 | 23 | 5.409158 | 4.252048217 | 3.33E-09 | 2.72E-07 |
| hsa05164 | Influenza A | 171 | 20 | 4.601821 | 4.346105729 | 2.59E-08 | 1.69E-06 |
| hsa04620 | Toll-like receptor signaling pathway | 104 | 15 | 2.798768 | 5.359500574 | 9.67E-08 | 5.25E-06 |
| hsa05340 | Primary immunodeficiency | 37 | 9 | 0.995716 | 9.038725292 | 4.01E-07 | 1.87E-05 |
| hsa05161 | Hepatitis B | 144 | 16 | 3.875218 | 4.128800442 | 1.38E-06 | 5.63E-05 |
| hsa05160 | Hepatitis C | 131 | 15 | 3.525372 | 4.254870685 | 2.04E-06 | 6.89E-05 |
| hsa05162 | Measles | 132 | 15 | 3.552283 | 4.222636816 | 2.25E-06 | 6.89E-05 |
Table 3. GO and KEGG pathway enrichment analysis of 285 genes.
| Category | Geneset | Description | Size | Overlap | Expected | Enrichment Ratio | P Value | FDR |
|---|---|---|---|---|---|---|---|---|
| GO | GO:0002521 | leukocyte differentiation | 496 | 42 | 9.043149436 | 4.644399642 | 0 | 0 |
| GO:0002694 | regulation of leukocyte activation | 481 | 42 | 8.769667094 | 4.789235389 | 0 | 0 | |
| GO:0098542 | defense response to other organism | 473 | 43 | 8.623809845 | 4.986195286 | 0 | 0 | |
| GO:0042110 | T cell activation | 452 | 40 | 8.240934567 | 4.85381842 | 0 | 0 | |
| GO:0050900 | leukocyte migration | 419 | 40 | 7.639273415 | 5.236100062 | 0 | 0 | |
| GO:1903706 | regulation of hemopoiesis | 389 | 40 | 7.092308731 | 5.639912406 | 0 | 0 | |
| GO:0009615 | response to virus | 319 | 37 | 5.816057803 | 6.361697434 | 0 | 0 | |
| GO:0060326 | cell chemotaxis | 289 | 34 | 5.269093119 | 6.452723312 | 0 | 0 | |
| GO:0070661 | leukocyte proliferation | 281 | 35 | 5.12323587 | 6.831619876 | 0 | 0 | |
| GO:1990868 | response to chemokine | 93 | 24 | 1.695590519 | 14.15436081 | 0 | 0 | |
| KEGG | hsa04062 | Chemokine signaling pathway | 189 | 34 | 4.909090909 | 6.925925926 | 0 | 0 |
| hsa04060 | Cytokine-cytokine receptor interaction | 294 | 36 | 7.636363636 | 4.714285714 | 2.44249E-15 | 3.98126E-13 | |
| hsa05169 | Epstein-Barr virus infection | 201 | 23 | 5.220779221 | 4.405472637 | 1.65478E-09 | 1.7982E-07 | |
| hsa05164 | Influenza A | 171 | 20 | 4.441558442 | 4.502923977 | 1.41264E-08 | 1.1513E-06 | |
| hsa04620 | Toll-like receptor signaling pathway | 104 | 15 | 2.701298701 | 5.552884615 | 6.03174E-08 | 3.86041E-06 | |
| hsa03010 | Ribosome | 153 | 18 | 3.974025974 | 4.529411765 | 7.10504E-08 | 3.86041E-06 | |
| hsa05161 | Hepatitis B | 144 | 17 | 3.74025974 | 4.545138889 | 1.5876E-07 | 7.39366E-06 | |
| hsa05340 | Primary immunodeficiency | 37 | 9 | 0.961038961 | 9.364864865 | 2.96446E-07 | 1.13916E-05 | |
| hsa05163 | Human cytomegalovirus infection | 225 | 21 | 5.844155844 | 3.593333333 | 3.14492E-07 | 1.13916E-05 | |
| hsa05212 | Pancreatic cancer | 75 | 12 | 1.948051948 | 6.16 | 4.18383E-07 | 1.36393E-05 |
Fig 4. The top 10 KEGG enrichment pathways of DEGs.
Hub gene and module screening from the PPI network
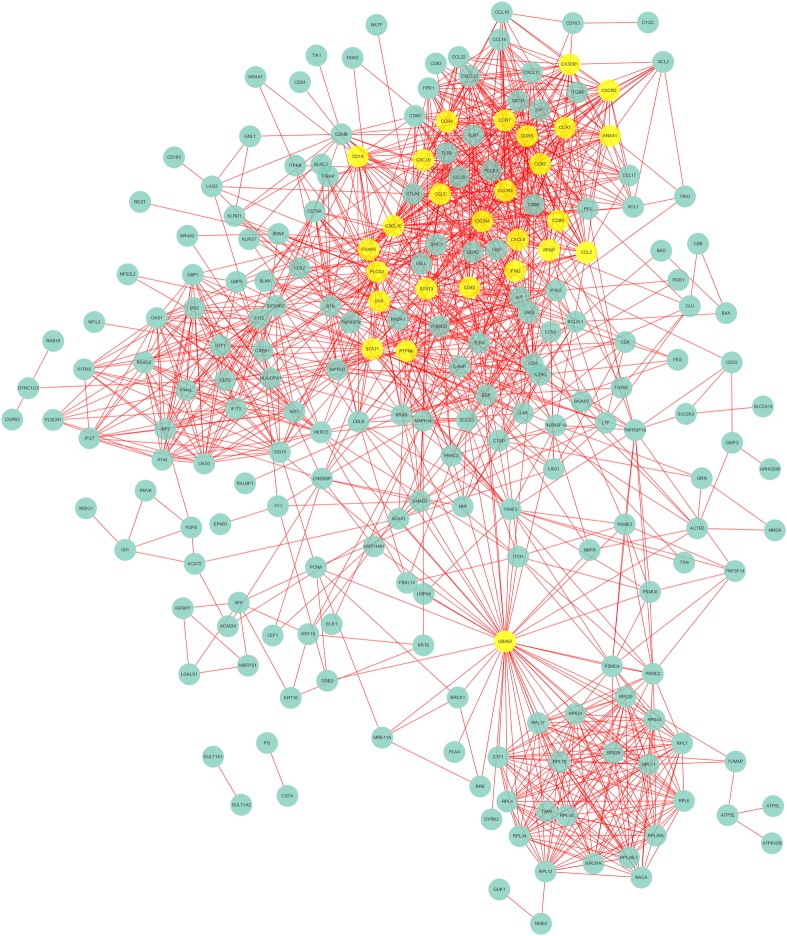
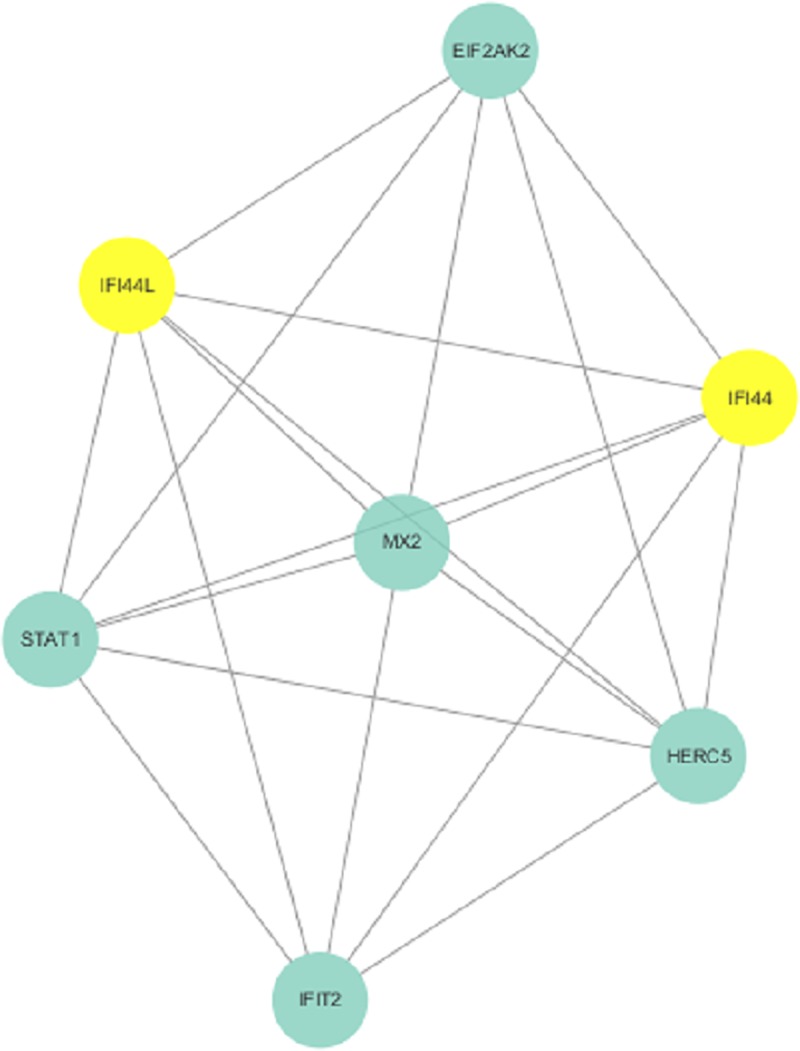
To further visualize the cellular functions and biological activities of the 285 genes, a genetic interaction network map of DEGs was drawn in Cytoscape. First, we identified a PPI network, which consisted of 285 nodes and 2,655 edges with a confidence score greater than 0.4 based on the STRING database. The top 27 hubs with degree centrality greater than 23 were screened as hub genes from the PPI network. These genes included annexin A1 (ANXA1), signal transducer and activator of transcription 1 (STAT1), signal transducer and activator of transcription 3 (STAT3), CX3C motif chemokine receptor 1 (CX3CR1), CXC motif chemokine receptor 2 (CXCR2), CC motif chemokine receptor 1 (CCR1), CC motif chemokine receptor 5 (CCR5), CC motif chemokine receptor 7 (CCR7), CC motif chemokine receptor 4 (CCR4), CC motif chemokine receptor 2 (CCR2), CXC motif chemokine ligand 9 (CXCL9), CD19 molecule (CD19), CXC motif chemokine receptor 3 (CXCR3), C motif chemokine ligand 5 (CCL5), CXC motif chemokine receptor 4 (CXCR4), CD86 molecule (CD86), CXC motif chemokine ligand 10 (CXCL10), forkhead box P3 (FOXP3), CXC motif chemokine ligand 8 (CXCL8), pro-platelet basic protein (PPBP), CC motif chemokine ligand 2 (CCL2), interferon gamma (IFNG), phospholipase C gamma 1 (PLCG1), spleen associated tyrosine kinase (SYK), CD40 molecule (CD40), protein tyrosine phosphatase nonreceptor type 6 (PTPN6), and ubiquitin A-52 residue ribosomal protein fusion product 1 (UBA52) (Fig 5). We then found 3 modules in the MCODE analysis and used Cluster 1 (related to ANXA1), Cluster 2 (related to IFI44 and IFI44L) and Cluster 3 (related to OAS1) for KEGG pathway enrichment analysis (Figs 6–8, Tables 4, S3 and S4).
Fig 5. Hub genes acquired from the PPI network.
Fig 6. Cluster 1 selected from the PPI network.
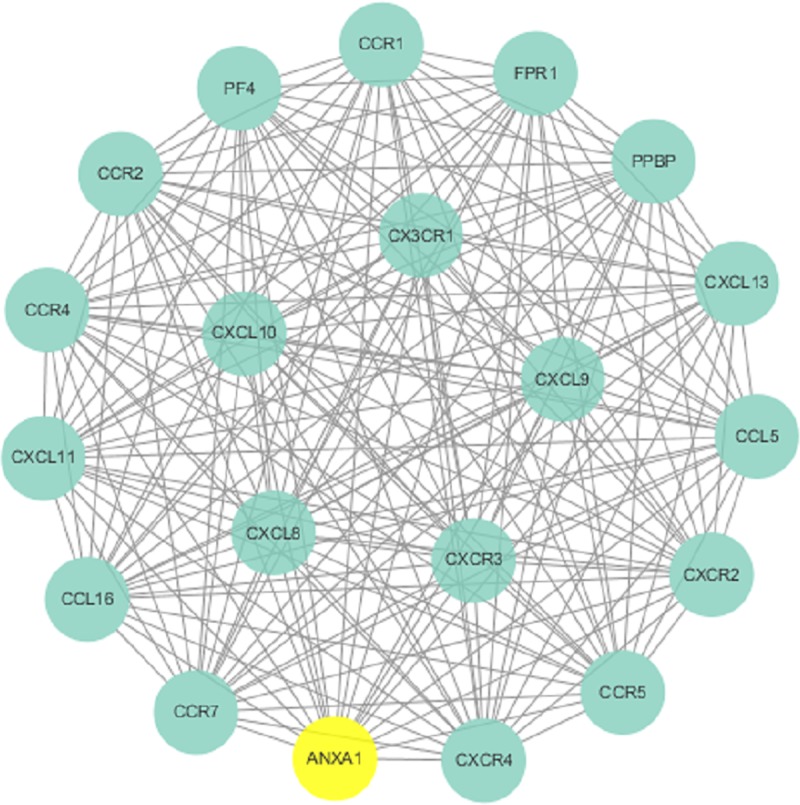
Fig 8. Cluster 3 selected from the PPI network.
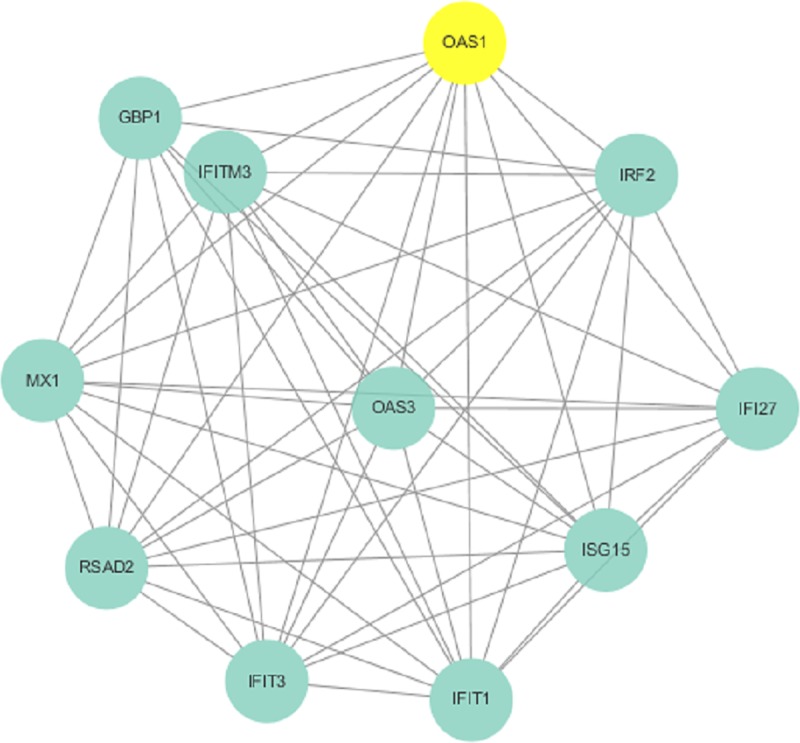
Table 4. The KEGG pathway enrichment analysis of Cluster 1.
| Geneset | Description | Size | Overlap | Expected | Enrichment Ratio | P Value | FDR |
|---|---|---|---|---|---|---|---|
| hsa04060 | Cytokine-cytokine receptor interaction | 294 | 18 | 0.74789128 | 24.0676692 | 0 | 0 |
| hsa04062 | Chemokine signaling pathway | 189 | 18 | 0.48078725 | 37.4385965 | 0 | 0 |
| hsa04620 | Toll-like receptor signaling pathway | 104 | 5 | 0.26456018 | 18.8992915 | 4.73E-06 | 5.14E-04 |
| hsa05163 | Human cytomegalovirus infection | 225 | 6 | 0.57236578 | 10.482807 | 1.37E-05 | 0.00111274 |
| hsa05120 | Epithelial cell signaling in Helicobacter pylori infection | 68 | 3 | 0.17298166 | 17.3428793 | 6.30E-04 | 0.04108467 |
| hsa05167 | Kaposi sarcoma-associated herpesvirus infection | 186 | 4 | 0.47315571 | 8.45387663 | 0.00107644 | 0.05848636 |
| hsa05164 | Influenza A | 171 | 3 | 0.43499799 | 6.89658356 | 0.0087241 | 0.40629393 |
| hsa04623 | Cytosolic DNA-sensing pathway | 63 | 2 | 0.16026242 | 12.4795322 | 0.01091775 | 0.44489832 |
| hsa04622 | RIG-I-like receptor signaling pathway | 70 | 2 | 0.17806935 | 11.2315789 | 0.01335851 | 0.48387498 |
| hsa05323 | Rheumatoid arthritis | 90 | 2 | 0.22894631 | 8.73567251 | 0.02149547 | 0.62095381 |
| hsa04144 | Endocytosis | 244 | 3 | 0.62069889 | 4.83326143 | 0.02266138 | 0.62095381 |
| hsa04657 | IL-17 signaling pathway | 93 | 2 | 0.23657786 | 8.45387663 | 0.0228572 | 0.62095381 |
| hsa05142 | Chagas disease (American trypanosomiasis) | 102 | 2 | 0.25947249 | 7.70794634 | 0.02715131 | 0.6808712 |
| hsa04668 | TNF signaling pathway | 110 | 2 | 0.27982327 | 7.14736842 | 0.03122221 | 0.72703143 |
Fig 7. Cluster 2 selected from the PPI network.
Discussion
The current early screening tools for tumors are limited to use at an identifiable stage, and most are invasive. The early stage of tumor formation may change the immune components in human PBMCs; Thus, utilizing such changes will aid in the detection of a new target for the early screening of tumors. Because tumors caused by blood diseases such as leukemia may change the composition of human PBMCs without an immune response, this study focused on early screening of solid tumors only. In addition, the statistics of terminal stages of cancer are not conducive to establishing a biomarker indicating the transformation of early stages. Ultimately, we examined 4 datasets chosen from among 797 datasets, involving 3 types of solid cancer.
In this study, we performed a meta-analysis of PBMCs between patients with solid tumors and normal healthy individuals to define possible target genes. A total of 285 genes were selected during this analysis. According to forest plot analysis of the 20 top genes, 4 genes (ANXA1, IFI44, IFI44L, and OAS1) were determined as the marker genes of PBMCs. All the P-values of the 4 genes were significant (P>0.05), demonstrating the stability of the genes being presented across each of the datasets. To classify the function of the 285 genes, GO and KEGG pathway enrichment analyses were performed. Furthermore, we chose the top 27 hub nodes with a degree centrality greater than 23 from the PPI network as hub genes and found 3 important clusters related to the four selected genes (ANXA1, IFI44, IFI44L, and OAS1). KEGG pathway enrichment analysis was also used to investigate the functions of these modules.
As reported in the majority of previous studies, ANXA1 is produced by many cell types, including peripheral blood leukocytes, where ANXA1 is mainly expressed in neutrophils.[17] Loss of function or expression of ANXA1 has been detected in multiple tumors. ANXA1 may function as either a tumor suppressor or a tumor promoter, depending on the type of tumor cells/tissues [18]. Additionally, some studies have shown that its positive expression is correlated positively with the progression of several types of cancers. In our study, we found that ANXA1 was overexpressed in the PBMCs of cancer patients, and thus hypothesized that it could serve as a biomarker of cancer diagnosis.
In terms of our analysis, we found the highest ratio of ANXA1 in the primary immunodeficiency pathway. Defects in immune cells, such as suppression of immune cell proliferation in patients, may be diagnosed as primary immunodeficiency. Enhanced expression of ANXA1 might reduce the in vitro peripheral blood lymphocyte response to mitogens, activate the ERK/MAPK pathway and reduce immune cell proliferation by disrupting the actin skeleton and abolishing cyclin D1 expression[19]. All these events give rise to primary immunodeficiency, facilitating tumor immunity escape. Other studies have reported the possible effects of ANXA1 on mitogen-activated T cells in humans. Consequently, overexpression of ANXA1 results in malignant proliferation of cancer cells by causing disorder in the immune system. Moreover, it was reported that increased ANXA1 expression can abolish COX-2 expression. COX-2 exerts a negative effect on immune surveillance, plays a key role in tumorigenesis, and is associated with angiogenesis in the transition period of carcinoma [20]. These mechanisms indicate that ANXA1 can mediate many diverse cellular functions, such as inflammation and proliferation, and has an important effect on suppressing the development of cancer.
In addition to the primary immunodeficiency pathway, a large proportion of the summarized genes, including ANXA1, are involved in the cytokine-cytokine receptor interaction reference pathway that affects the status of carcinoma. Most genes in Cluster 1 are linked to the cytokine-cytokine receptor interaction. Moreover, ANXA1 was included in Cluster 1, with many genes included in the CC and CXC subfamilies. Both families of chemokine factors are involved in the chemotaxis of leukocytes and promote the proliferation of immune cells, resulting in pleiotropic effects including the stimulation of monocytes, natural killer and T-cell migration, and the modulation of adhesion molecule expression. These actions inhibit the expansion of tumors. Thus, we suggest that ANXA1 might influence the course of neoplasms by affecting interaction between cytokines. High ANXA1 expression exerts its effect via inhibition of CC and CXC subfamily members, leading to a restricted in immune response to cancers. Regarding other aspects of the cytokine-cytokine receptor interaction reference pathway, cytoplasmic ANXA1 exhibits anti-inflammatory activity by inhibiting phospholipase A2. Extracellular ANXA1 regulates leukocyte migratory events through interactions with n-formyl peptide receptors, binding to the formyl peptide receptor (FPR) on neutrophils and preventing transendothelial extravasation. These activities interrupt the process of leukocyte migratory events and suppress immune system attack of cancers. These findings may explain elevated expression of ANXA1 in infiltrating leukocytes. Alternately, as a substrate protein of EGFR, ANXA1 may contribute to neoplasm growth via autocrine and paracrine effects and sustain the preinvasive properties of malignant cancers through autocrine signaling induced by the N-terminal peptide [21].
All the samples we selected were from cancer patients with an exact diagnosis, most reaching a diagnosable stage. At this stage, the immune system is weaker with regard to combating cancer and cannot effectively stop the malignant growth of tumors. ANXA1 is expressed at low levels in PBMCs with benign tumors, which would affect malignant expansion. Decreased expression of ANXA1 has been shown to be responsible for a strong delay of proliferation, migration/invasion, and angiogenesis in melanoma, lung carcinoma, NSCLC, breast cancer, and prostate cancer models [22]. In general, ANXA1 is aberrantly expressed in both benign and malignant tumor stages compared with that in the healthy population. Because of its abnormal expression in PBMCs, ANXA1 might be a meaningful biomarker for cancer diagnosis and is considered a primary mediator of anti-inflammatory activity.
Our study also found IFI44, IFI44L, and OAS1 to be overexpressed. These genes are associated with interferons. Expression of OAS1 is induced by interferons against cancers. IFI44 belongs to the INF-α family, mediating the inflammatory response. IFI44L might be a novel tumor suppressor that affects cancer stemness, metastasis, and drug resistance in cancer cells.
Radiotherapy and systemic chemotherapy are the traditional choices of treatments for patients with cancer. However, they also induced a range of side effects due to their nonselective killing of malignant and normal cells. Immune checkpoint blockade has improved cancer treatment with lower rates of treatment-related toxicity. Abnormal changes in the molecular characteristics of the immune microenvironment are also helpful for the early diagnosis of malignant tumors and for understanding of immunosuppression in patients. In this study, overexpression of ANXA1 in the PBMCs of cancer patients, depending on the cancer proliferation status, suggests the potency of ANXA1 as a biomarker of the identification of cancer. This finding might help us in detecting cancer much earlier. Furthermore, this ANXA1 overexpression depending on the cancer proliferation status suggests the potency of ANXA1 as a biomarker of the identification of cancer, aiding in the identification of cancer early.
This study was exploratory, defining a specific tool using PBMCs as biomarker for identifying solid tumors at an early stage. This approach has not yet been popularized and requires formal and independent validation. Nonetheless, we hope to continue this research on the basis of our results.
Conclusions
ANXA1 is involved in the immunosuppressive mechanism of tumor-bearing hosts and can be used as a new strategy involving the use of the host's own immunity to achieve tumor suppression. IFI44, IFI44L and OAS1 are potential diagnostic biomarkers, though the results for these genes were not as remarkable as those for ANXA1. However, our study mainly describes the variation in ANXA1 in several solid cancers, and the inclusion of more cancer types and application of further experiments for validation are needed.
Supporting information
(ZIP)
(ZIP)
(XLSX)
(DOCX)
(DOCX)
(DOCX)
Acknowledgments
We would like to thank Zheran Liu for his help during the paper submission, Zhaohao Huang for his patience and help in the paper writing, and Dr Chao Shi for his help correcting the cancer concepts and descriptions.
Data Availability
All relevant data are within the manuscript and its Supporting Information files.
Funding Statement
This work was supported by National Natural Science Foundation of China [grant number 81660041 to L.D.]; Natural Science Foundation of Jiangxi Province [grant numbers 20171BAB205109 to X.T., 20181BAB205008 to L.D.]; Youth Science Foundation of Jiangxi Province [grant number 20161BAB215248 to Y.X.]. The funders had no role in study design, data collection and analysis, decision to publish, or preparation of the manuscript.
References
- 1.Kobayashi N, Hiraoka N, Yamagami W, Ojima H, Kanai Y, Kosuge T, et al. FOXP3+ regulatory T cells affect the development and progression of hepatocarcinogenesis. Clin Cancer Res. 2007;13(3):902–11. Epub 2007/02/10. 10.1158/1078-0432.CCR-06-2363 . [DOI] [PubMed] [Google Scholar]
- 2.Aaroe J, Lindahl T, Dumeaux V, Saebo S, Tobin D, Hagen N, et al. Gene expression profiling of peripheral blood cells for early detection of breast cancer. Breast Cancer Res. 2010;12(1):R7 Epub 2010/01/19. 10.1186/bcr2472 [DOI] [PMC free article] [PubMed] [Google Scholar]
- 3.Marckmann G, In der Schmitten J. Cancer screening from the perspective of public health ethics. Bundesgesundheitsblatt, Gesundheitsforschung, Gesundheitsschutz. 2014;57(3):327–33. Epub 2014/02/25. 10.1007/s00103-013-1913-0 . [DOI] [PubMed] [Google Scholar]
- 4.Parmeshwar R, Rajan SS, Shrestha K. Principles of cancer screening. Surgery (Oxford). 2018;36(3):139–44. 10.1016/j.mpsur.2017.12.008. [DOI] [Google Scholar]
- 5.Weedon-Fekjaer H, Lindqvist BH, Vatten LJ, Aalen OO, Tretli S. Breast cancer tumor growth estimated through mammography screening data. Breast Cancer Res. 2008;10(3):R41 Epub 2008/05/10. 10.1186/bcr2092 [DOI] [PMC free article] [PubMed] [Google Scholar]
- 6.Tainsky MA. Genomic and proteomic biomarkers for cancer: a multitude of opportunities. Biochim Biophys Acta. 2009;1796(2):176–93. Epub 2009/05/02. 10.1016/j.bbcan.2009.04.004 [DOI] [PMC free article] [PubMed] [Google Scholar]
- 7.Schiffman JD, Fisher PG, Gibbs P. Early detection of cancer: past, present, and future. Am Soc Clin Oncol Educ Book. 2015:57–65. Epub 2015/05/21. 10.14694/EdBook_AM.2015.35.57 . [DOI] [PubMed] [Google Scholar]
- 8.Osman I, Bajorin DF, Sun TT, Zhong H, Douglas D, Scattergood J, et al. Novel blood biomarkers of human urinary bladder cancer. Clin Cancer Res. 2006;12(11 Pt 1):3374–80. Epub 2006/06/03. 10.1158/1078-0432.CCR-05-2081 . [DOI] [PubMed] [Google Scholar]
- 9.Han M, Liew CT, Zhang HW, Chao S, Zheng R, Yip KT, et al. Novel blood-based, five-gene biomarker set for the detection of colorectal cancer. Clin Cancer Res. 2008;14(2):455–60. Epub 2008/01/22. 10.1158/1078-0432.CCR-07-1801 . [DOI] [PubMed] [Google Scholar]
- 10.Williams MA, Newland AC, Kelsey SM. The potential for monocyte-mediated immunotherapy during infection and malignancy. Part I: apoptosis induction and cytotoxic mechanisms. Leukemia & lymphoma. 1999;34(1–2):1–23. Epub 1999/06/01. 10.3109/10428199909083376 . [DOI] [PubMed] [Google Scholar]
- 11.Vinay DS, Ryan EP, Pawelec G, Talib WH, Stagg J, Elkord E, et al. Immune evasion in cancer: Mechanistic basis and therapeutic strategies. Semin Cancer Biol. 2015;35 Suppl:S185–S98. Epub 2015/03/31. 10.1016/j.semcancer.2015.03.004 . [DOI] [PubMed] [Google Scholar]
- 12.Burczynski ME, Twine NC, Dukart G, Marshall B, Hidalgo M, Stadler WM, et al. Transcriptional profiles in peripheral blood mononuclear cells prognostic of clinical outcomes in patients with advanced renal cell carcinoma. Clin Cancer Res. 2005;11(3):1181–9. Epub 2005/02/15. . [PubMed] [Google Scholar]
- 13.Twine NC, Stover JA, Marshall B, Dukart G, Hidalgo M, Stadler W, et al. Disease-associated expression profiles in peripheral blood mononuclear cells from patients with advanced renal cell carcinoma. Cancer Res. 2003;63(18):6069–75. Epub 2003/10/03. . [PubMed] [Google Scholar]
- 14.Sharma P, Sahni NS, Tibshirani R, Skaane P, Urdal P, Berghagen H, et al. Early detection of breast cancer based on gene-expression patterns in peripheral blood cells. Breast Cancer Res. 2005;7(5):R634–44. Epub 2005/09/20. 10.1186/bcr1203 [DOI] [PMC free article] [PubMed] [Google Scholar]
- 15.Showe MK, Vachani A, Kossenkov AV, Yousef M, Nichols C, Nikonova EV, et al. Gene expression profiles in peripheral blood mononuclear cells can distinguish patients with non-small cell lung cancer from patients with nonmalignant lung disease. Cancer Res. 2009;69(24):9202–10. Epub 2009/12/03. 10.1158/0008-5472.CAN-09-1378 [DOI] [PMC free article] [PubMed] [Google Scholar]
- 16.Sakai Y, Honda M, Fujinaga H, Tatsumi I, Mizukoshi E, Nakamoto Y, et al. Common transcriptional signature of tumor-infiltrating mononuclear inflammatory cells and peripheral blood mononuclear cells in hepatocellular carcinoma patients. Cancer Res. 2008;68(24):10267–79. Epub 2008/12/17. 10.1158/0008-5472.CAN-08-0911 . [DOI] [PubMed] [Google Scholar]
- 17.Torres LS, Okumura JV, Silva DG, Mimura KK, Belini-Junior E, Oliveira RG, et al. Inflammation in Sickle Cell Disease: Differential and Down-Expressed Plasma Levels of Annexin A1 Protein. PLoS One. 2016;11(11):e0165833 Epub 2016/11/02. 10.1371/journal.pone.0165833 [DOI] [PMC free article] [PubMed] [Google Scholar]
- 18.Kamal AM, Smith SF, De Silva Wijayasinghe M, Solito E, Corrigan CJ. An annexin 1 (ANXA1)-derived peptide inhibits prototype antigen-driven human T cell Th1 and Th2 responses in vitro. Clin Exp Allergy. 2001;31(7):1116–25. Epub 2001/07/27. 10.1046/j.1365-2222.2001.01137.x . [DOI] [PubMed] [Google Scholar]
- 19.Koseki H, Shiiba K, Suzuki Y, Asanuma T, Matsuno S. Enhanced expression of lipocortin-1 as a new immunosuppressive protein in cancer patients and its influence on reduced in vitro peripheral blood lymphocyte response to mitogens. Surg Today. 1997;27(1):30–9. 10.1007/bf01366936 WOS:A1997WE34000006. [DOI] [PubMed] [Google Scholar]
- 20.Gao Y, Chen Y, Xu D, Wang J, Yu G. Differential expression of ANXA1 in benign human gastrointestinal tissues and cancers. BMC Cancer. 2014;14:520 Epub 2014/07/21. 10.1186/1471-2407-14-520 [DOI] [PMC free article] [PubMed] [Google Scholar]
- 21.Vecchi L, Alves Pereira Zoia M, Goss Santos T, de Oliveira Beserra A, Colaco Ramos CM, Franca Matias Colombo B, et al. Inhibition of the AnxA1/FPR1 autocrine axis reduces MDA-MB-231 breast cancer cell growth and aggressiveness in vitro and in vivo. Biochim Biophys Acta Mol Cell Res. 2018;1865(9):1368–82. Epub 2018/06/23. 10.1016/j.bbamcr.2018.06.010 . [DOI] [PubMed] [Google Scholar]
- 22.Belvedere R, Saggese P, Pessolano E, Memoli D, Bizzarro V, Rizzo F, et al. miR-196a Is Able to Restore the Aggressive Phenotype of Annexin A1 Knock-Out in Pancreatic Cancer Cells by CRISPR/Cas9 Genome Editing. Int J Mol Sci. 2018;19(7). ARTN 196710.3390/ijms19071967. WOS:000442807400146. [DOI] [PMC free article] [PubMed] [Google Scholar]
Associated Data
This section collects any data citations, data availability statements, or supplementary materials included in this article.
Supplementary Materials
(ZIP)
(ZIP)
(XLSX)
(DOCX)
(DOCX)
(DOCX)
Data Availability Statement
All relevant data are within the manuscript and its Supporting Information files.


